
Figures & data
Table 1. Clinicopathological characteristics of breast cancer patients overall and by levels of GLUT1 immunoexpression.
Figure 1. Cytoplasmic expression of GLUT1 in breast cancer. a: negative stain (20X); b: weak positive stain (20 X); c: moderate positive stain (20 X); d: strong positive stain (20X).
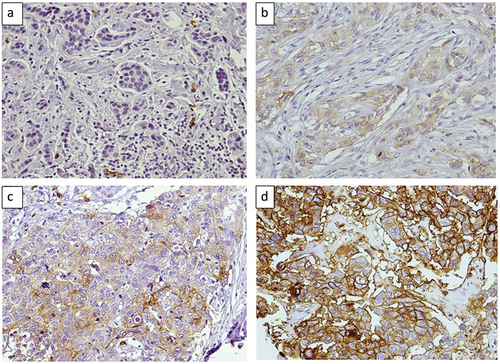
Table 2. Odds ratios (95% CI) of the association between histopathological characteristics and GLUT1 immunoexpression level×.