
Figures & data
Table 1. Master mix preparation for HRV detection.
Table 2. Baseline clinical data for the study participants (N = 78).
Figure 1. Flow chart of COPD patients/samples groups analyzed. Seventy-eight participants provided at least one sputum sample during the study. A total of 148 sputum samples were included in this study, consisting of 58 exacerbation-related (E1) sputum samples (from 58 patients) and 62 sputum samples (from 58 patients) two weeks after the exacerbation episode (E2).
Figure 2. The prevalence of the pulmonary exacerbations of COPD patients (N=58) plotted over the duration of the study. the prevalence of pulmonary exacerbations of COPD was recorded across the entire study interval (November 2021 to October 2022). The prevalence of COPD exacerbation was higher throughout the winter and autumn months followed by the spring months, with the lowest level of detection occurring in the summer months.
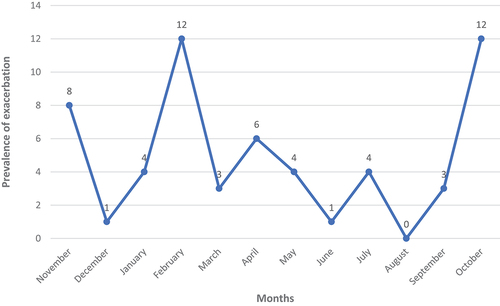
Table 3. HRV detection rates during the study period: the overall prevalence of HRV in the non-matched samples and participants.
Table 4. The difference in the proportion of HRV-positivity at the E1 and E2 states (N = 52 paired COPD patients).
Figure 3. The numbers of HRV detections throughout the study. The prevalence of HRV-positive samples was recorded across the entire study interval (November 2021 to October 2022). HRV was detected throughout winter and spring, with the lowest level of detection occurring in the summer months.
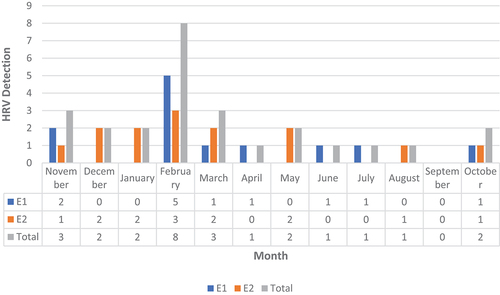
Table 5. Summary of cases showing twice HRV detection during the study period (n = 5 patients).