Figures & data
Figure 1. The two most widely used variants of NASCAR racetrack jet dryers.
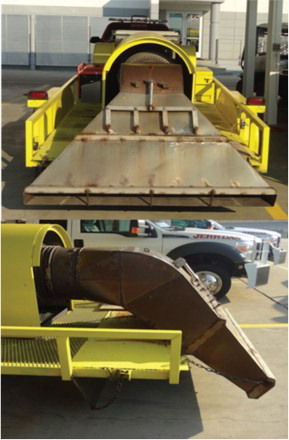
Figure 2. The schematic configuration of a planar wall jet.
Figure 3. The computational domain and mesh.
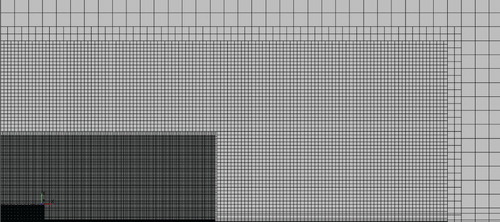
Figure 4. Mean velocity distribution in inner scaling at
.
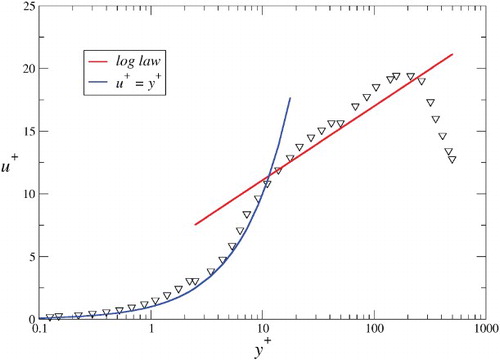
Table 1. Comparison between the experimental and CFD-predicted values of the normalized wall friction velocity and location of the maximum streamwise mean velocity at  .
.
Figure 5. Profiles of the streamwise velocity at , scaled with inner variables.
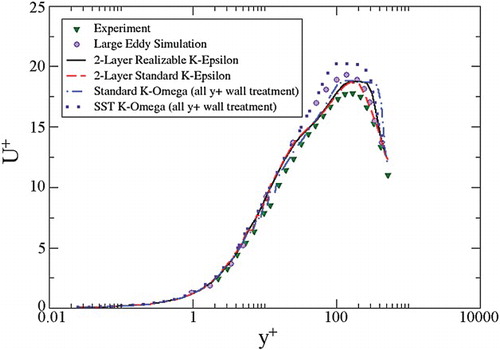
Figure 6. Profiles of the wall-normal velocity at , scaled with inner variables.
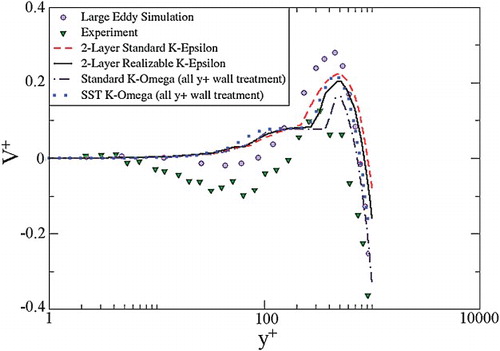
Figure 7. Comparison between the experimental data and CFD predictions of Reynolds shear stress at
and 20.
Figure 8. Comparison between the experimental and CFD-predicted (a) jet growth rate and (b) decay of streamwise mean velocity.
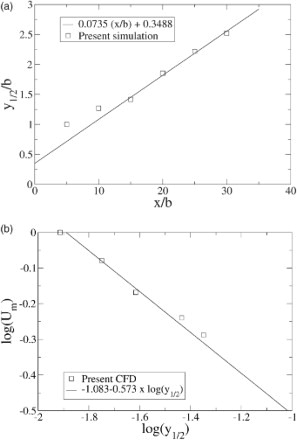
Figure 9. Schematic diagram of an offset jet showing zones of primary interest.
Figure 10. The streamwise decay of the maximum streamwise local mean velocity ;
is scaled with the reattachment length
(top), and with the jet height
(bottom).
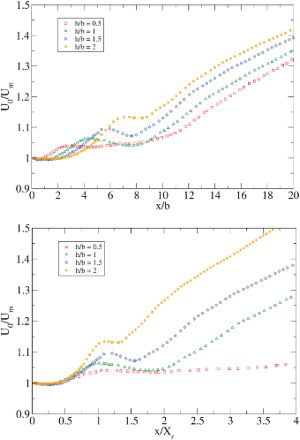
Figure 11. The streamwise evolution of the jet half-width ();
is scaled with the reattachment length
(top), and with the jet height
(bottom).
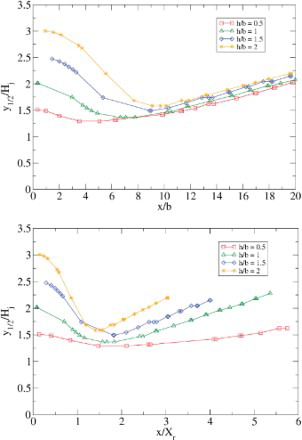
Figure 12. Mean velocity vectors corresponding with the wall offset of , whole flow view (top), and zoomed-in view (bottom).
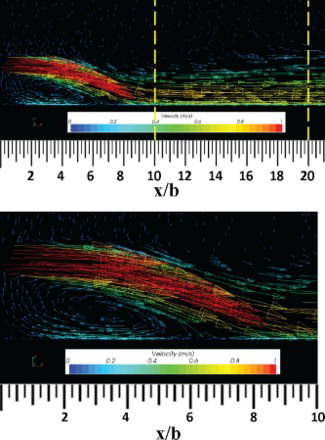
Figure 13. Contours of the mean streamwise velocity with , 0.5, 1.0, 1.5 and 2.0.
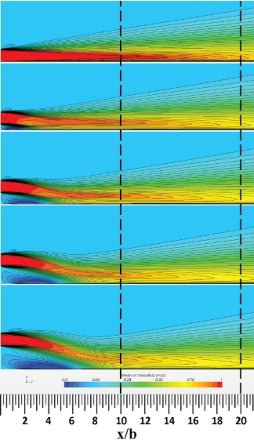
Figure 14. Contours of the mean wall-normal velocity with , 0.5, 1.0, 1.5 and 2.0.
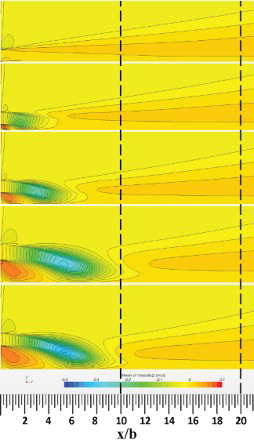
Figure 15. Contours of the mean pressure with , 0.5, 1.0, 1.5 and 2.0.
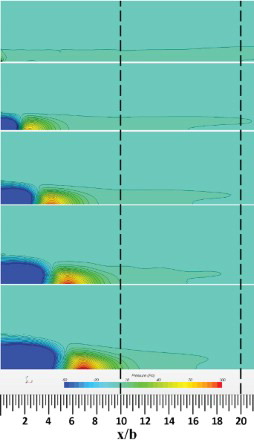
Figure 16. Contours of the mean TKE with, 0.5, 1.0, 1.5 and 2.0.
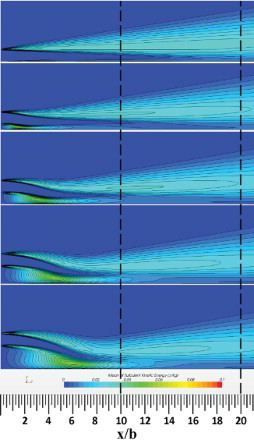
Figure 17. Streamwise distributions of the wall pressure coefficient for different jet offsets.
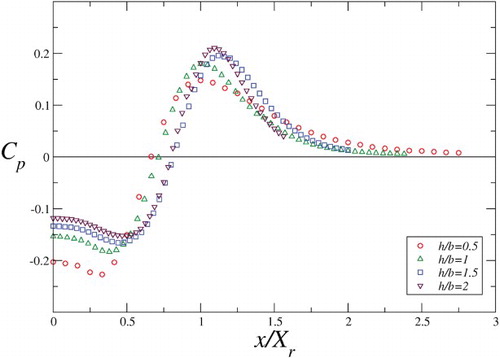
Figure 18. Dependence of the reattachment length on the wall offset.