Figures & data
Figure 1. A two-domain decomposition strategy, Block1 and Block2.
Figure 2. The multi-domain decomposition strategy for (a) two blocks; (b) four blocks.
Table 1. The iteration steps for each block (two-domain decomposition strategy) for a two-dimensional lid-driven cavity flow.
Figure 3. Streamlines in the two-dimensional cavity flow at for: (a) Case (I); (b) Case (II); (c) Case (III).
Figure 4. Streamlines in the two-dimensional cavity flow at for: (a) Case (I); (b) Case (II); (c) Case (III).
Figure 5. Streamlines in the two-dimensional cavity flow at for: (a) Case (I); (b) Case (II); (c) Case (III).
Figure 6. Streamlines in the two-dimensional cavity flow at for: (a) Case (I); (b) Case (III).
Table 2. The central locations of vortices for the lid-driven cavity flow for  , and .
Figure 7. Comparison of the profiles of the u-velocity through the geometric center in the present results and those of Ghia et al. (Citation1982) at along: (a) the vertical line; (b) the horizontal line.
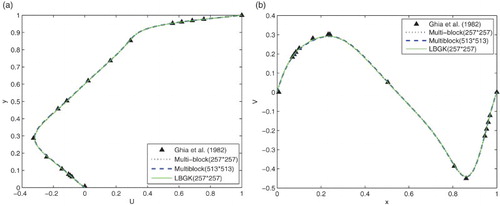
Figure 8. Comparison of the profiles of the u-velocity through the geometric center in the present results and those of Ghia et al. (Citation1982) at Re = 1000 along: (a) the vertical line; (b) the horizontal line.
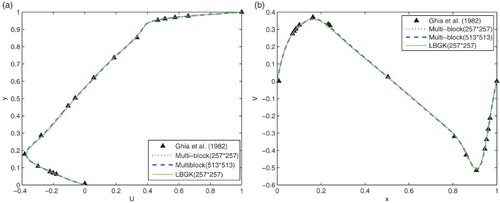
Figure 9. Comparison of the profiles of the u-velocity through the geometric center in the present results and those of Ghia et al. (Citation1982) at Re = 5000 along: (a) the vertical line; (b) the horizontal line.
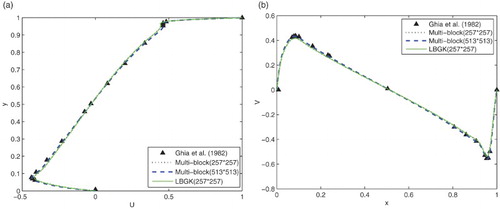
Figure 10. Comparison of the profiles of the u-velocity through the geometric center in the present results and those of Ghia et al. (Citation1982) at Re = 10,000 along: (a) the vertical line; (b) the horizontal line.
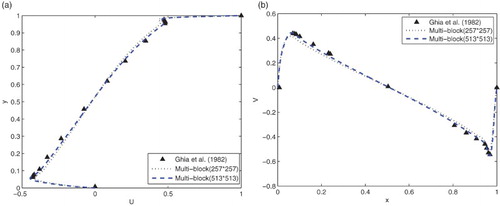
Table 3. The iteration steps of each block (four-domain decomposition strategy) in a two-dimensional lid-driven cavity flow.
Table 4. The central locations of vortices for the lid-driven cavity flow for and 10,000.
Figure 11. The multi-domain decomposition strategy in the flow around a circular cylinder (three blocks).
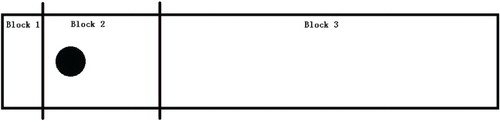
Figure 12. Streamlines of the steady-state flow around a circular cylinder at .
Figure 13. Streamlines of the steady-state flow around a circular cylinder at .
Figure 14. Streamlines of the steady-state flow around a circular cylinder at .
Table 5. The iteration steps for each block (three-domain decomposition strategy) in the flow around a circular cylinder.
Figure 15. The computational distribution of each block at . Note: Blue represents the steps during which Block1 is computed, and green represents the steps during which Block2 is computed, while all flow fields are being computed in the remaining steps.
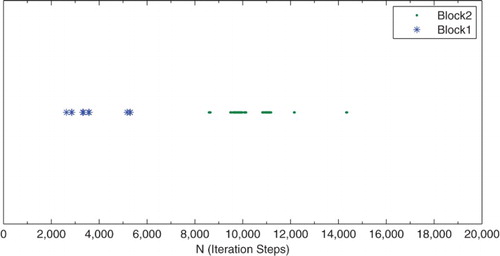
Figure 16. A Von Karman Vortex Street and streamlines of the flow around a circular cylinder at .
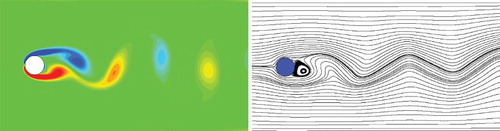
Table 6. The iterations of each block (two-domain decomposition strategy) in the flow around a circular cylinder.
Figure 17. The two-domain decomposition strategy for a three-dimensional lid-driven cavity flow.
Table 7. The iterations of each block for the three-dimensional lid-driven cavity flow.
Figure 18. (a) The streamlines and (b) the velocity for the three-dimensional lid-driven cavity flow at .
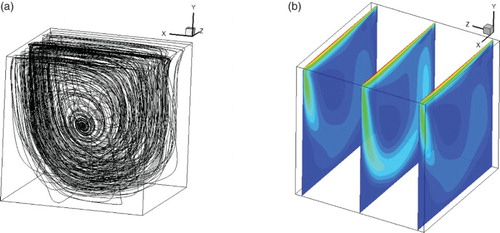
Figure 19. The two-domain decomposition strategy in the flow around a sphere.
Table 8. The iterations of each block in the flow around a sphere.
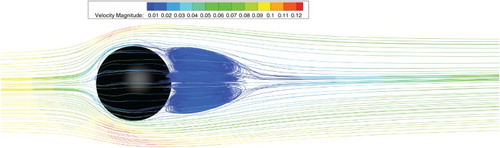
Figure 20. The streamlines of the flow around a sphere .