Figures & data
Figure 1. Classification of coupling schemes and interaction between particles and turbulence according to Elghobashi (1994) for (1) one-way coupling, (2) two-way coupling where particles enhance turbulence production, (3) two-way coupling where particles enhance turbulence dissipation, and (4) four-way coupling.
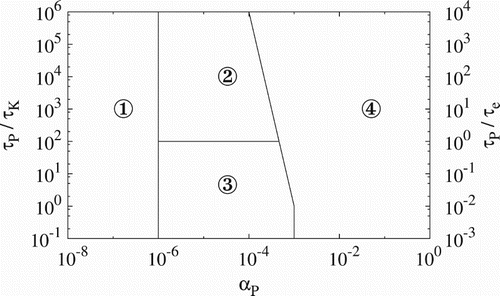
Table 1. Numerical methods, schemes and boundary conditions in ANSYS FLUENT and OpenFOAM.
Figure 2. Geometry of the BFS according to Fessler and Eaton (Citation1999).
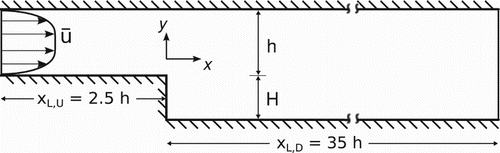
Table 2. Flow properties for the BFS.
Table 3. Applied meshes.
Table 4. Boundary and initial conditions for the BFS case.
Figure 3. Comparison of the flow profiles of the continuous phase behind the BFS from simulations in ANSYS FLUENT and OpenFOAM and experiments according to Fessler and Eaton (Citation1999), for the velocity distribution of the main component (top), and distribution of the velocity fluctuation
(bottom).
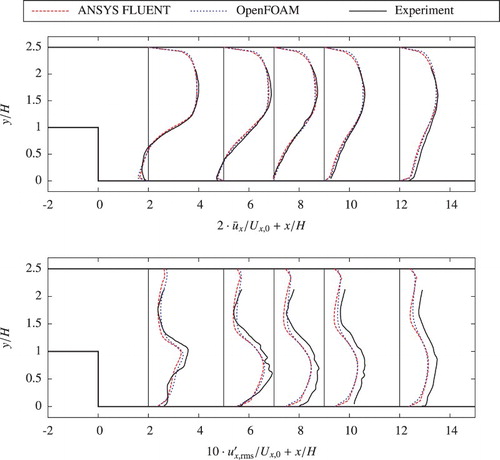
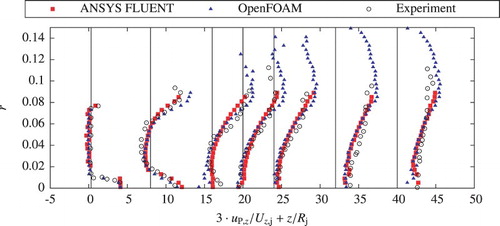
Figure 4. Comparison of the velocity profiles of the dispersed phase in the main direction behind the BFS from simulations in ANSYS FLUENT and OpenFOAM on meshes A, B and C and experiments according to Fessler and Eaton (Citation1999).
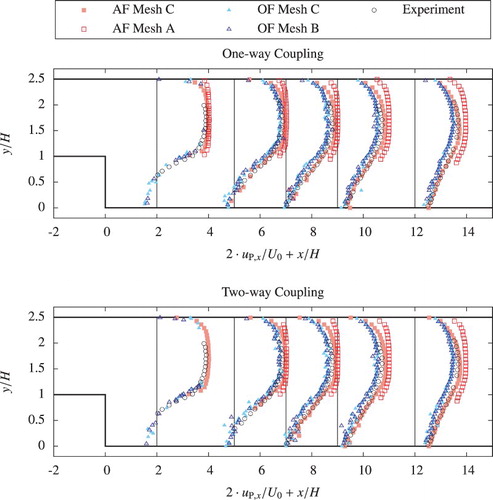
Figure 5. Comparison of the velocity profiles of the dispersed phase in the main direction behind the BFS from simulations in ANSYS FLUENT and OpenFOAM on mesh D and experiments according to Fessler and Eaton (Citation1999).
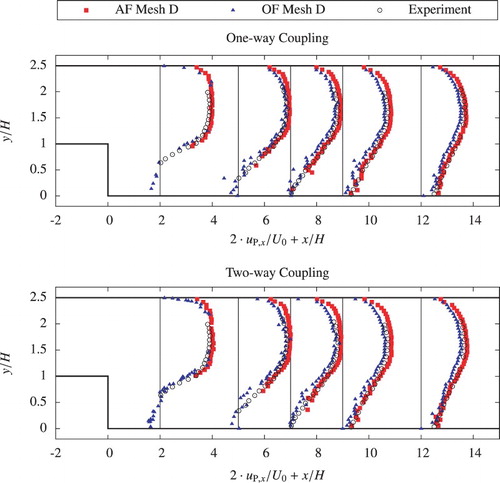
Figure 6. Geometry of the CBB test case according to Borée et al. (Citation2001).
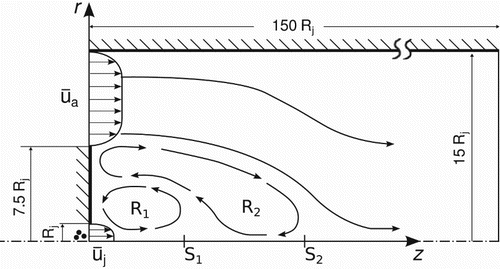
Table 5. Boundary and initial conditions for the CBB case.
Figure 7. Comparison of the velocity distribution along the symmetry line in the main flow direction of the continuous phase in the CBB from simulations in ANSYS FLUENT and OpenFOAM and experiments according to Borée et al. (Citation2001).
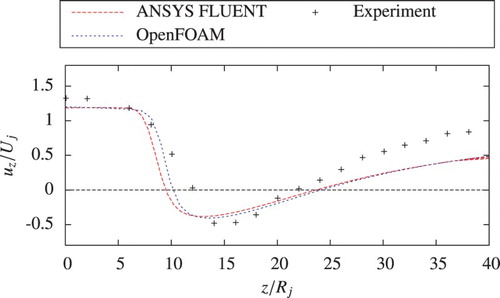
Figure 8. Comparison of the velocity distributions in the main flow direction of the continuous phase in the CBB from simulations in ANSYS FLUENT and OpenFOAM and experiments according to Borée et al. (Citation2001).
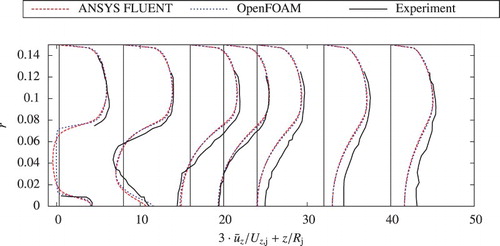
Figure 9. Comparison of the velocity distributions in main flow direction of the dispersed phase in the CBB from simulations in ANSYS FLUENT and OpenFOAM and experiments according to Borée et al. (Citation2001).