Figures & data
Figure 1. Test-rig schematic.
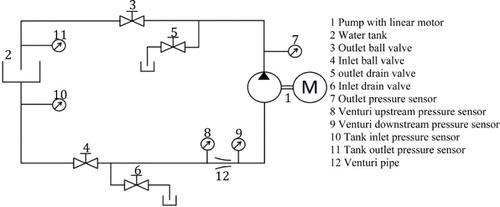
Figure 2. Section of the PD pump on the symmetry plane.
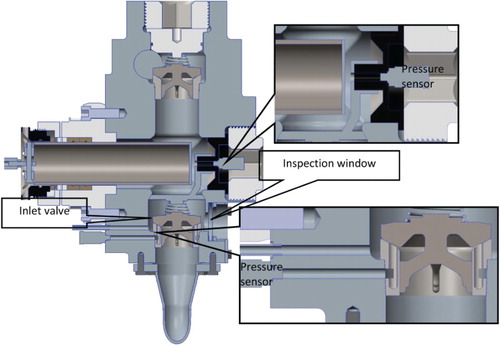
Table 1. Pressure sensor characteristics summary.
Figure 3. Plunger displacements and velocities fed into the motor drive administration software are shown.
Figure 4. Decomposition pattern of the fluid volumes of the pump chamber (Iannetti et al., Citation2014a).
Figure 5. View of the mesh utilized for the analysis.
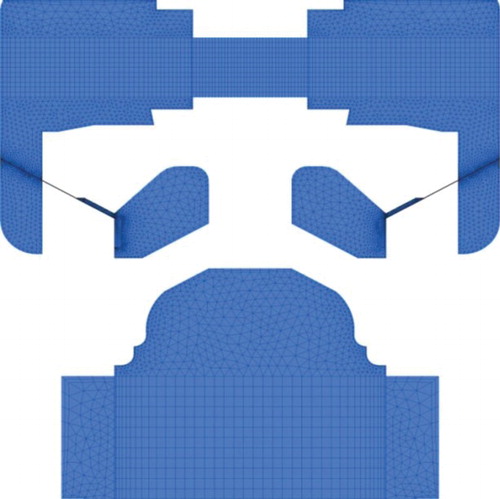
Table 2. Mesh sensitivity analysis for three mesh sizes.
Table 3. Mesh 2 details summary.
Figure 6. UDF scheme operations (Iannetti et al., Citation2014b).
Table 4. Solver settings summary.
Figure 7. (a) Pump chamber static pressure and (b) valve-seat static pressure for the experimental and CFD model results of Test 1.
Figure 8. (a) Second phase fraction composition according to the CFD model and (b) valve lift for the experimental and CFD model results of Test 1.
Figure 9. Null/incipient cavitation.
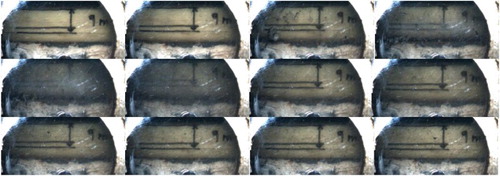
Figure 10. (a) Pump chamber static pressure (log scale) and (b) valve-seat static pressure (log scale) for the experimental and CFD model results of Test 2.
Figure 11. (a) Second phase fraction composition according to the CFD model and (b) valve lift for the experimental and CFD model results of Test 2.
Figure 12. Partial cavitation.
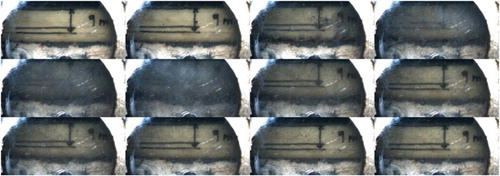
Figure 13. (a) Pump chamber static pressure and (b) valve-seat static pressure for the experimental and CFD model results of Test 3 demonstrating the sensitivity of the CFD model to the air mass fraction.
Figure 14. (a) The vapor volume fraction in the valve-seat lift volume and (b) the air volume fraction in the valve-seat lift volume according to the CFD model of Test 3.
Figure 15. Valve lift for the experimental and CFD model results of Test 3 demonstrating the sensitivity of the CFD model to the air mass fraction.
Figure 16. Full cavitation.
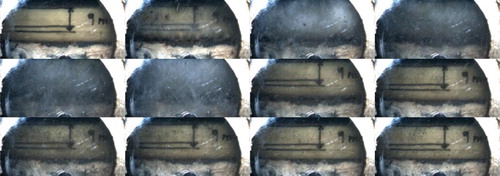
Figure 17. FFT of the chamber pressure signals for the experimental and CFD model results of Test 3.