Figures & data
Figure 1. Experimental model geometry.
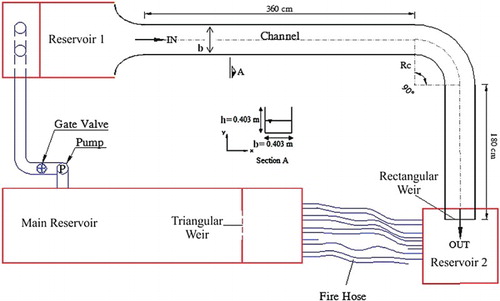
Figure 2. Experimental model scheme.
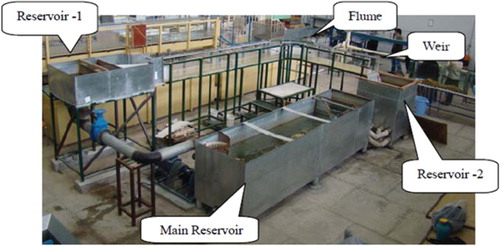
Table 1. Different experimental hydraulic properties.
Figure 3. DT-MLP procedure.
Figure 4. (a) Three-dimensional view of the cross sections, (b) example of the 13 points in a cross section and (c) example of the point coordinates.
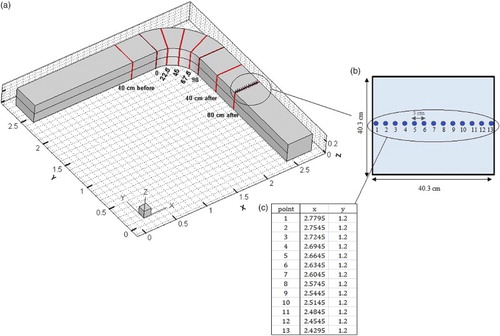
Figure 5. DT-MLP velocity classification results.
Figure 6. Comparison of the velocity values predicted by the MLP and DT-MLP models with the experimental values for the training dataset.
Figure 7. DT-MLP water surface.
Figure 8. Scatter plot of experimental values with the MLP and DT-MLP models for the test dataset and with separate results relating to each discharge rate for one run.
Figure 9. Transverse distribution of depth-averaged velocity for the MLP and DT-MLP models compared with the experimental values at different discharge rates.
Table 2. MAE error values of the velocity transverse profile for the MLP and DT-MLP models at different discharge rates and cross sections.
Figure 10. The transverse profile of water surface predicted by the MLP and DT-MLP models compared with the experimental results at different discharge rates at cross sections of (a) 0°, (b) 45°, (c) 90° and (d) 40 cm after the bend.
Table 3. MAE error values of the water surface transverse profile for the MLP and DT-MLP models at different discharge rates and cross sections.
Table 4. Evaluation of the MLR, MLP and DT-MLP models in terms of velocity and water depth prediction with the testing dataset.
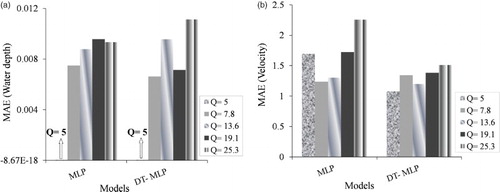
Figure 11. The MAE error bar graph for the MLP and DT-MLP models with the test dataset at different discharge rates for predicting (a) water surface depth and (b) velocity.