Figures & data
Figure 1. The Lagrangian and Eulerian domains.
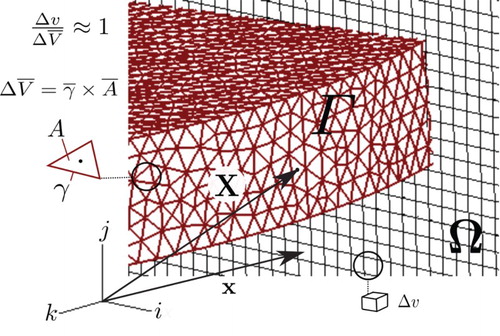
Figure 2. Comparison of (a) properly and (b) improperly nested meshes.
Figure 3. Lagrangian mesh covered by Eulerian refinement blocks.
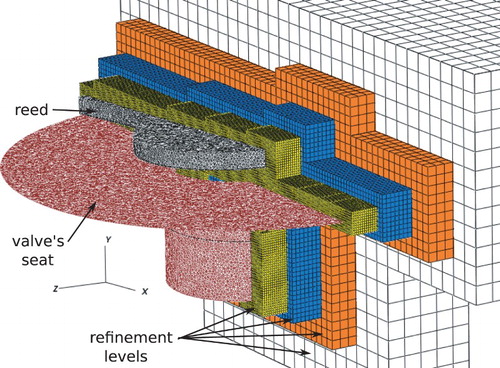
Figure 4. Definition of x* and z* variables on the reed's surface.
Figure 5. Mesh convergence test for the code used in the present work.
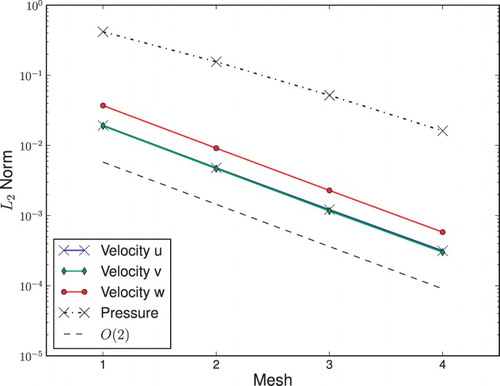
Figure 6. Radial diffuser geometric proportions used for the numerical validation.
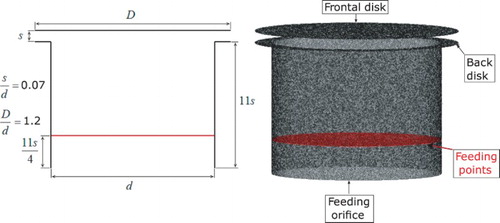
Figure 7. Calculation domain to solve the flow through a radial diffuser for the numerical validation.
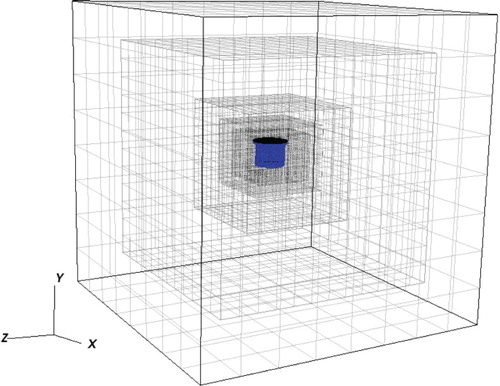
Figure 8. Mesh construction over the diffuser's geometry.
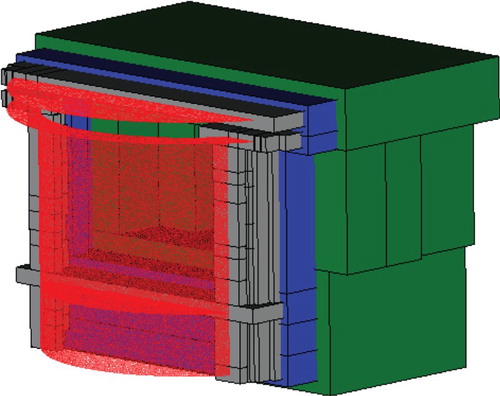
Figure 9. Norm evolution with time for different cycling numbers for frontal disk points.
Figure 10. Norm evolution with time for different cycling numbers for feeding points.
Figure 11. Norm evolution with time for different cycling numbers for valve seat points.
Figure 12. Comparison of pressure profiles obtained in the present simulations with experimental data.
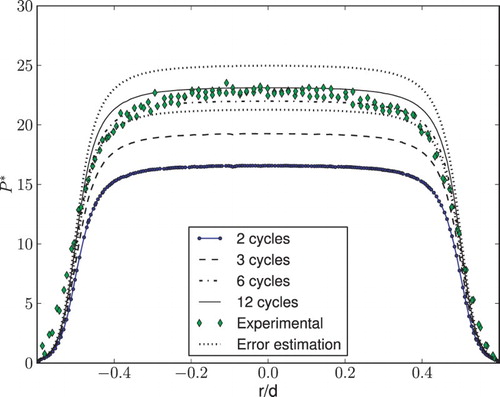
Figure 13. Minimum reed inclination angle view with regions affected.
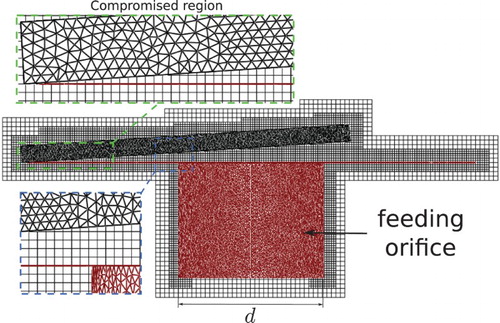
Figure 14. Eulerian domain with refinement blocks covering the immersed boundary.
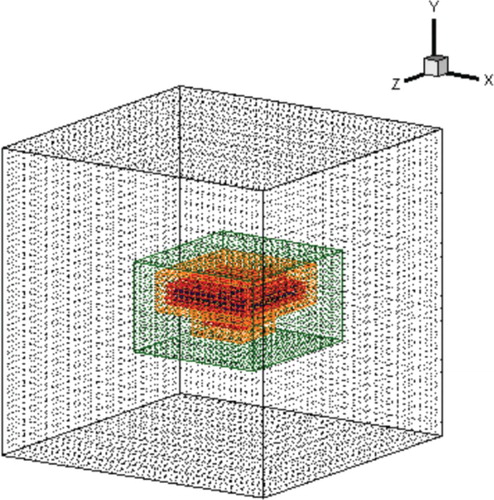
Figure 15. L2 norm evolution with time for the model presented in this work.
Figure 16. Vector field on a slice passing through the center of the feeding orifice for the opening movement.
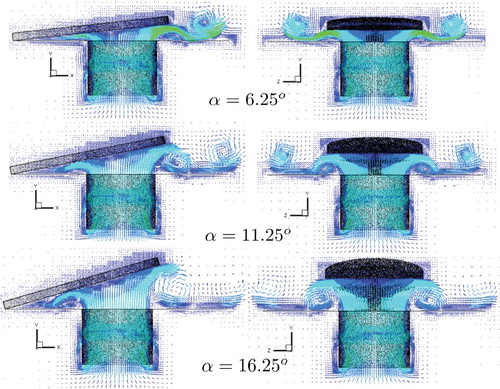
Figure 17. Vector field on a slice passing through the center of the feeding orifice for the closing movement.
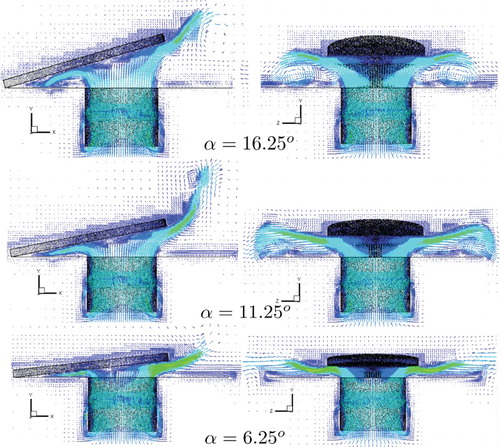
Figure 18. Vector field on a slice passing through the center of the feeding orifice for the opening movement for different Reynolds numbers.
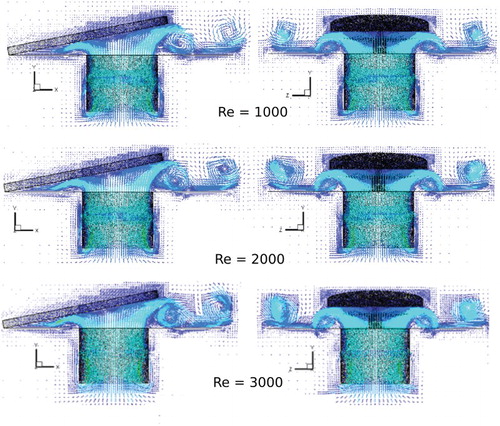
Figure 19. Vector field on a slice passing through the center of the feeding orifice for the closing movement for different Reynolds numbers.
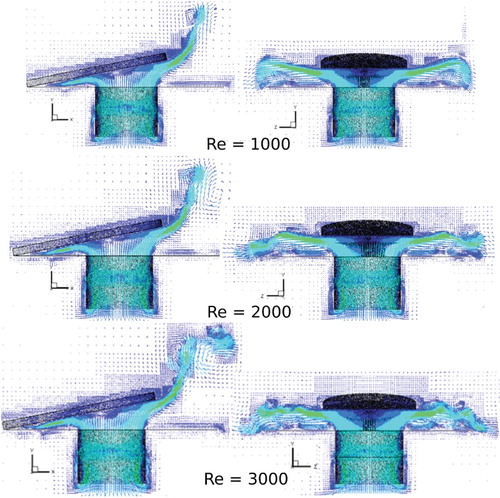
Figure 20. Pressure field at a z plane passing through the center of geometry for α = 6.25° and Re = 1000.
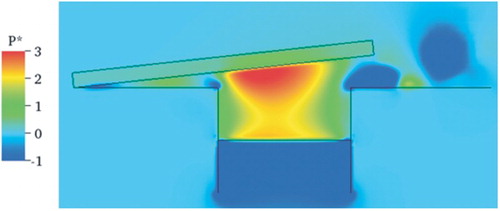
Figure 21. Pressure field at a z plane passing through the center of geometry for α = 6.25° and Re = 2000.
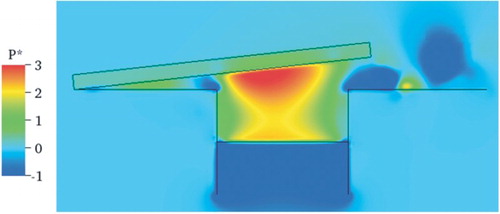
Figure 22. Pressure field at a z plane passing through the center of geometry for α = 6.25° and Re = 3000.
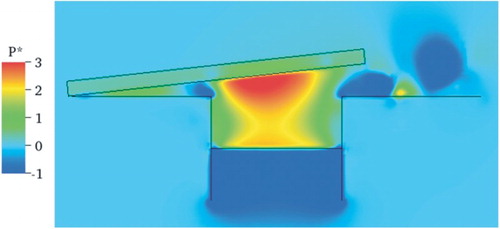
Figure 23. Pressure profiles in x* for the opening movement.
Figure 24. Pressure profiles in z* for the opening movement.
Figure 25. Pressure profiles in x* for the closing movement.
Figure 26. Pressure profiles in z* for the closing movement.
Figure 27. Pressure profiles in x* for the opening movement for different Reynolds numbers and α = 6.25°.
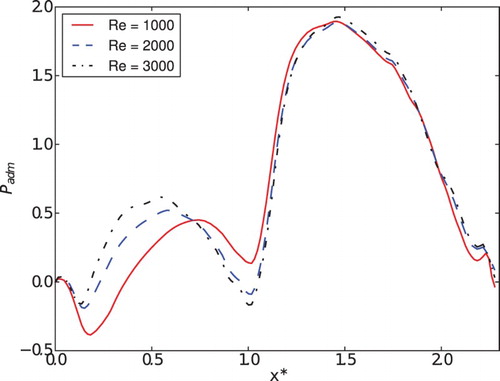
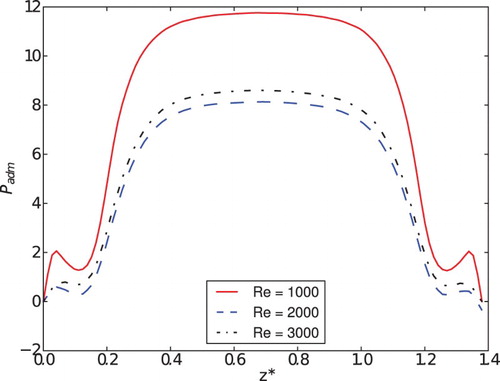
Figure 28. Pressure profiles in z* for the opening movement for different Reynolds numbers and α = 6.25°.
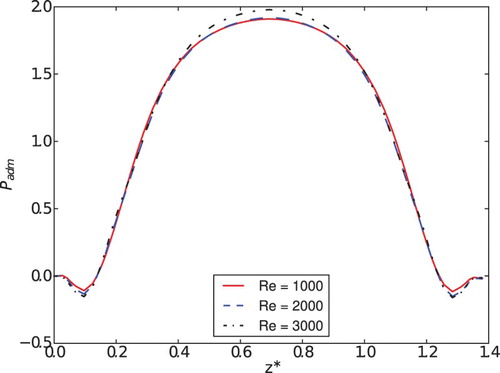
Figure 29. Pressure profiles in x* for the closing movement for different Reynolds numbers and α = 3.75°.

Figure 30. Pressure profiles in z* for the closing movement for different Reynolds numbers and α = 3.75°.