Figures & data
Figure 1. Roof fan.
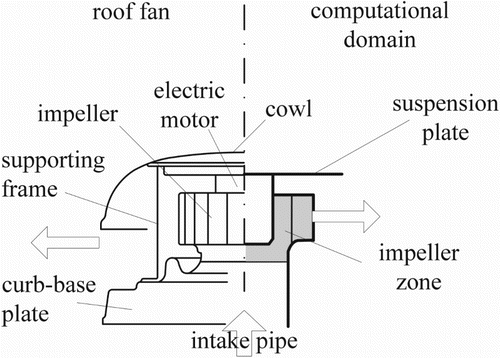
Figure 2. Roof fan impeller.
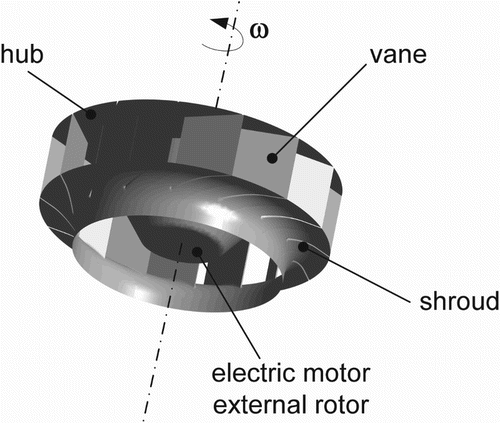
Figure 3. Fan segment.
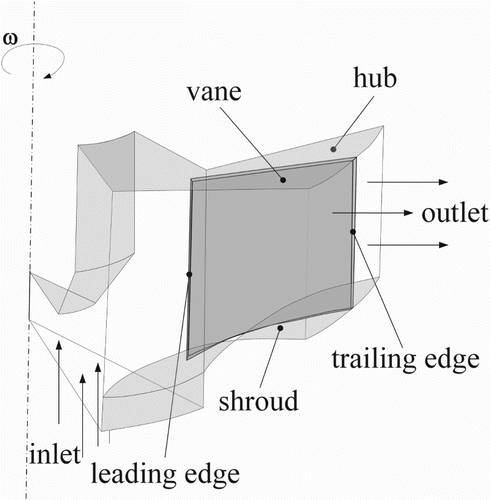
Figure 4. Computational domain and boundary conditions.
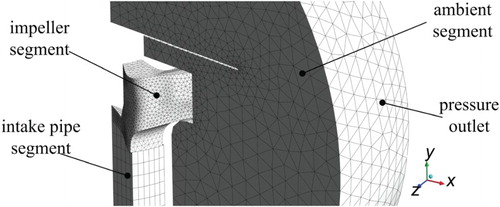
Figure 5. Procedure of shape optimization and design synthesis using an evolutionary optimization algorithm and CFD simulation.
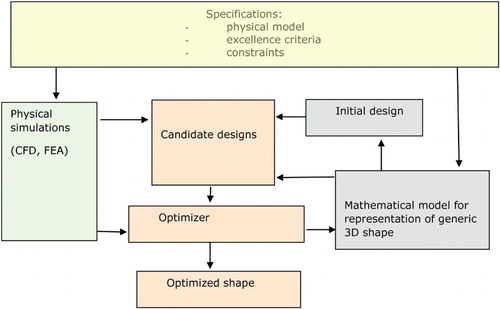
Figure 6. C1 continuity patch interfaces.
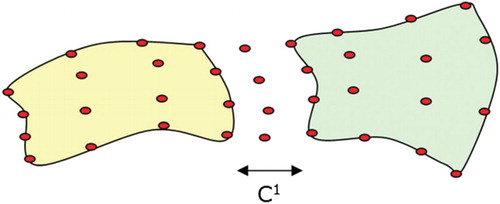
Figure 7. Parameterization of vane.
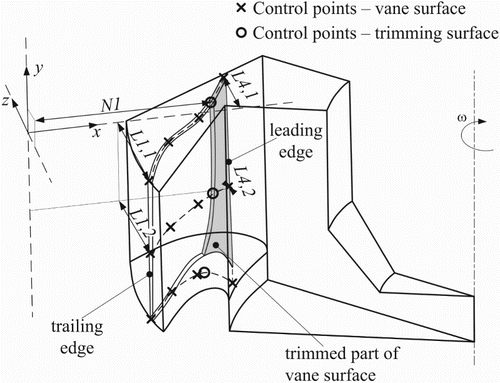
Figure 8. Parameterization of domain with rigid periodic boundaries.
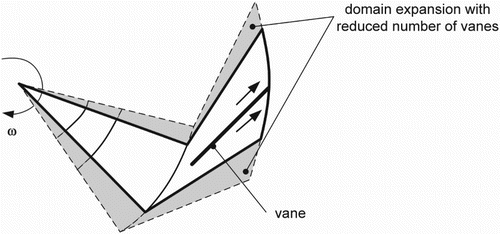
Figure 9. Central surface for the generation of periodic boundaries for parameterization with flexible periodic boundaries.
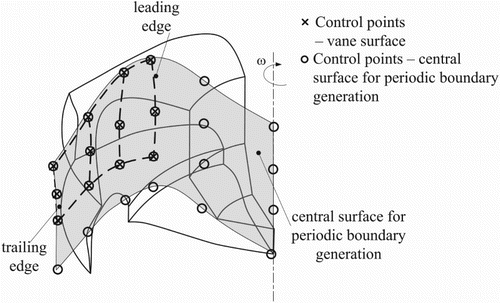
Figure 10. Shape optimization variables in computational workflow.
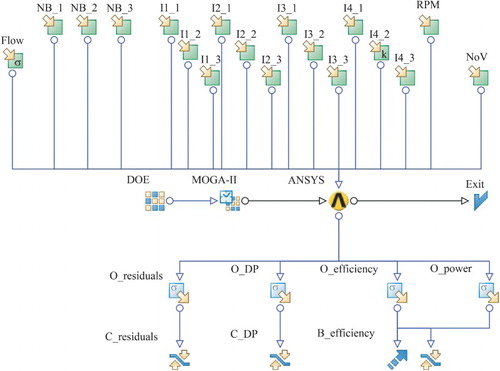
Table 1. Conducted optimization cases for various set of constraints.
Figure 11. Optimization of Case 4 using Sobol population initialization with 100 designs.
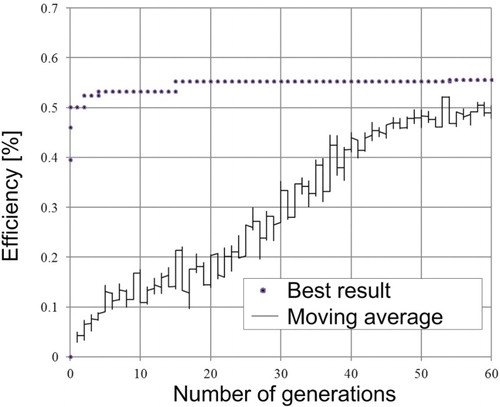
Figure 12. Perspective view of Case 4 for solution with: (a) flexible periodic boundaries and (b) rigid periodic boundaries.
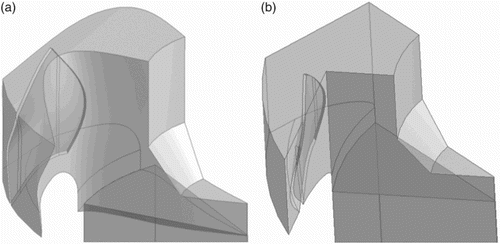
Figure 13. Efficiency characteristics of fan designed using he robust optimization procedure obtained for a model using flexible periodic boundaries and rigid periodic boundaries.
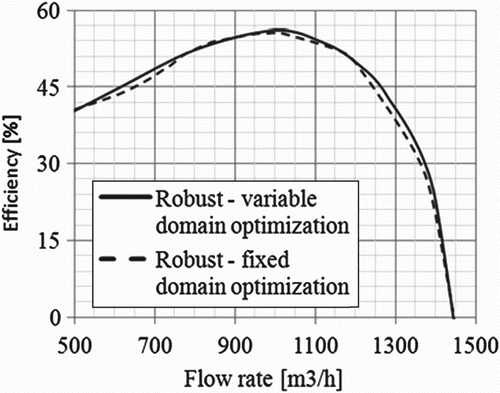
Figure 14. Case 2 optimized vane profile (shroud, midspan and hub) compared to Case 1.
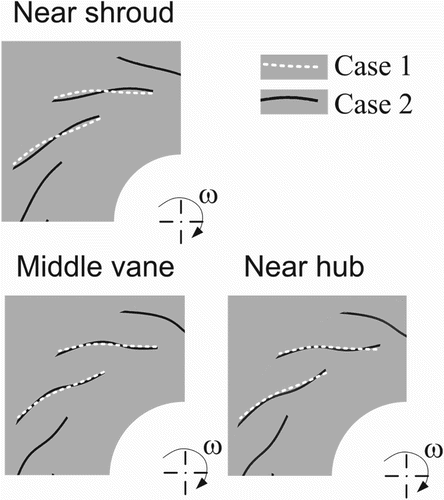
Figure 15 Fan performance for Case 2 (single point) and Case 3 (robust) compared with Case 1.
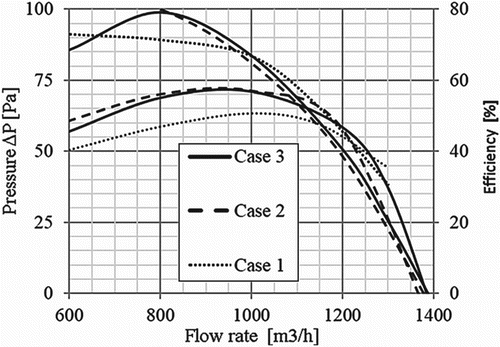
Figure 16. Case 3 optimized vane profile (shroud, midspan and hub).
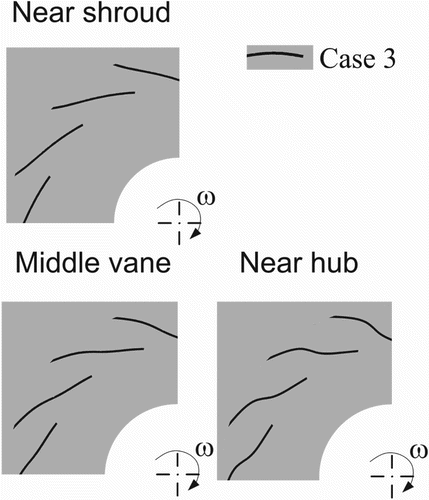
Figure 17. Comparison of Case 4 with Case 4b optimization.
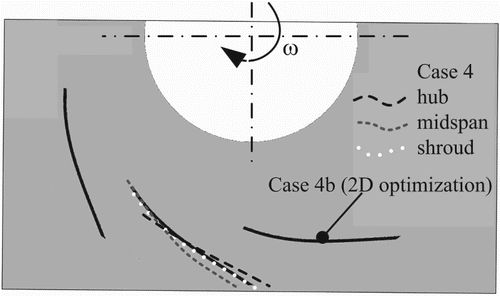
Figure 18. Fan characteristics for optimized impeller vanes for Case 4.
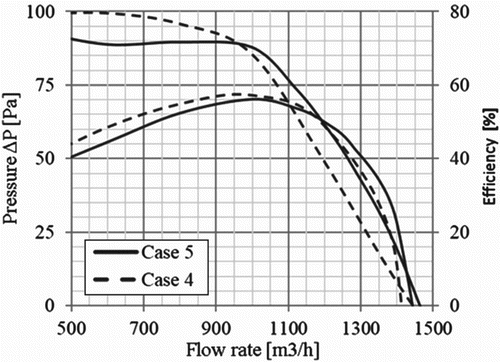
Figure 19. Iso lines of efficiency and rotational speed for Case 4.
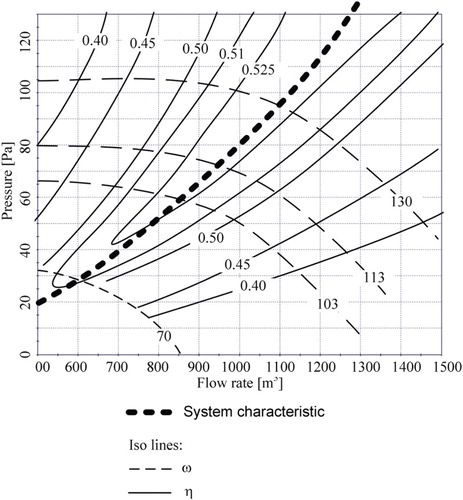
Figure 20. Case 5 vane profile (shroud, midspan and hub).
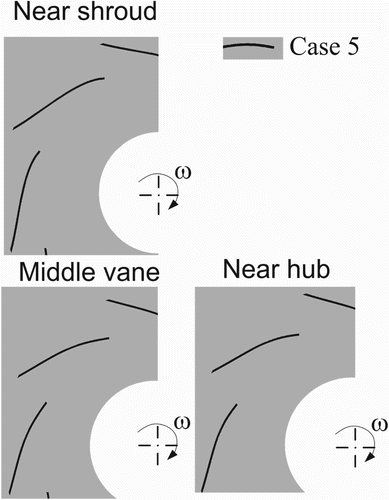
Figure 21. Flow patterns for V = 1000 m3/h: (a) separation of flow in upper part of impeller channel, (b) recirculation region along vane suction side, (c) flow pattern for optimized 3D vane in Case 2, and (d) sectional view of optimized 3D vane (suction side) without separation.
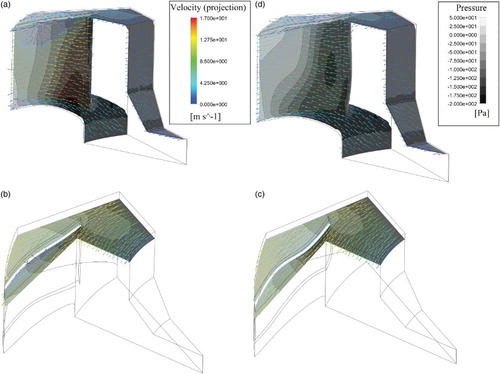
Figure 22. Dipole source strength derived (Ffowcs-Williams & Hawkings, Citation1969) for Case 4 optimized in (a) a rigid domain parameterization and (b) a flexible domain parameterization.
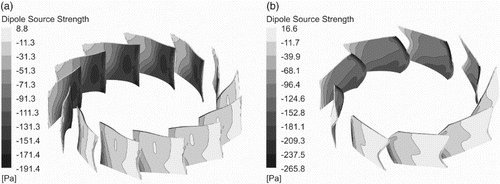
Figure 23. Pareto front obtained by multi-objective optimization for maximum efficiency and minimal noise.
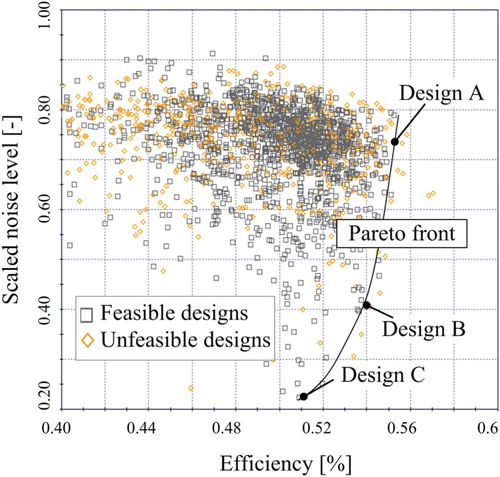
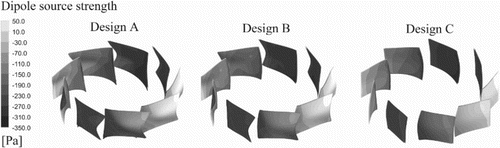
Figure 24. Dipole source strength isometric view of selected designs on the Pareto front from multi-objective optimization.