Figures & data
Figure 1. Definition sketch: expansive transition of rectangular to trapezoidal.
Figure 2. Experimental setup for flow depth and velocity measurements.
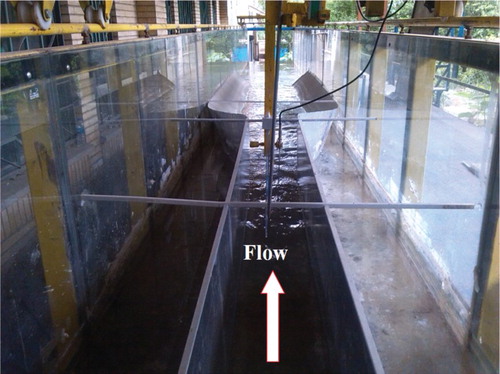
Figure 3. (a) Top view of flume and (b) a section showing the points where velocity measurements were taken.
Table 1. Range of flow hydraulic characteristics.
Figure 4. (a) Plan and (b) 3D view of the generated mesh in the computational domain.
Figure 5. Measured water surface profiles for different Froude numbers for Q = 10 l/s.
Figure 6. Velocity distributions across the width and along the length of the transition.
Figure 7. Efficiency of the transition for different inlet discharges.
Figure 8. Energy loss coefficient along the transition for different Froude numbers.
Figure 9. Water surface profiles for different inlet Froude numbers for Q = 20 l/s.
Figure 10. Velocity distribution for Q = 10 l/s and Fr1 = 0.47 at (a) the transition inlet, (b) the transition middle and (c) the transition outlet.
Figure 11. Streamlines near the water surface for different discharges.
Figure 12. Streamlines in various cross-sections along the transition for Q = 25 l/s.