Figures & data
Figure 1. Tumble control schematic diagram of the variable tumble intake port.
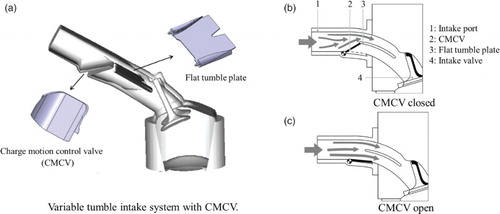
Figure 2. The four piston shapes used in this study: Bowl (Piston A), Flat (Piston B), Flat with bowl in center (Piston C), and Dual offset bowls (Piston D).
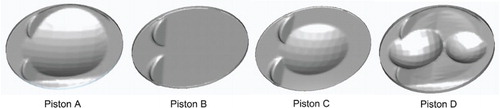
Table 1. GDI engine specifications and conditions.
Figure 3. Cylinder pressure curve simulation results for different numbers of cells.
Figure 4. Total number of grids and time steps in the calculation process.
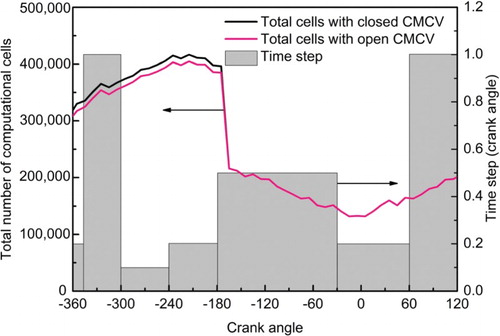
Figure 5. Computational mesh of GDI engine with CMCV at BDC (for Piston C): (a) intake port mesh with CMCV and (b) computational mesh and cut plane.
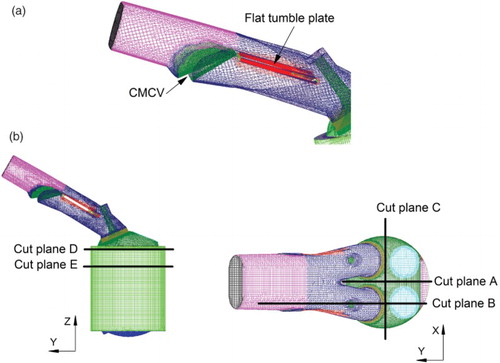
Table 2. The cell size for the computational mesh for different pistons.
Figure 6. Ensemble-averaged PIV images and the simulation results (with the CMCV closed at cut plane A) for (a) the computational domain, (b) PIV images, (c) k- results and (d) k-
-f results.
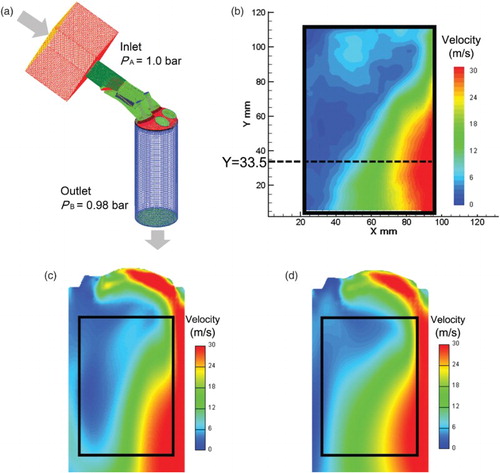
Figure 7. Velocity component for the PIV results and different simulation models (Z = 33.5).
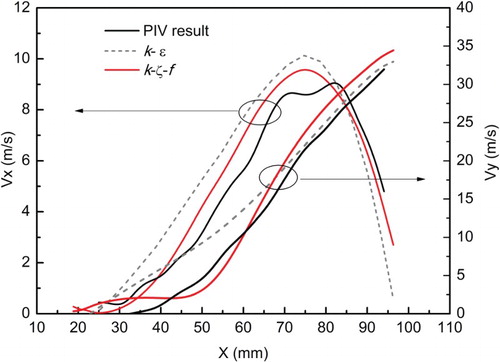
Figure 8. Spray experiment measurements and simulations (injection pressure = 10 MPa) for: (a) comparison of spray formal and (b) comparison of spray penetration.
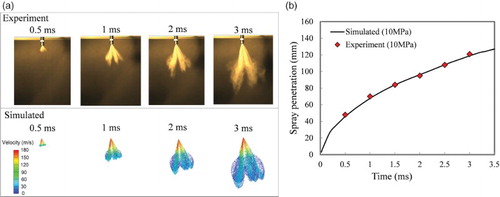
Figure 9. Experimental and simulated cylinder pressure curves at: (a) 1500 r/min and (b) 2000 r/min.
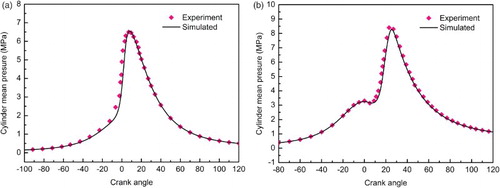
Figure 10. Tumble ratio for the four piston designs with both CMCV states at (a) 1500 r/min, (b) 2000 r/min and (c) 5500 r/min.
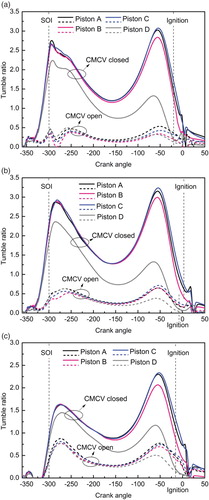
Figure 11. Maximum tumble ratio in the compression stroke for the four piston designs.
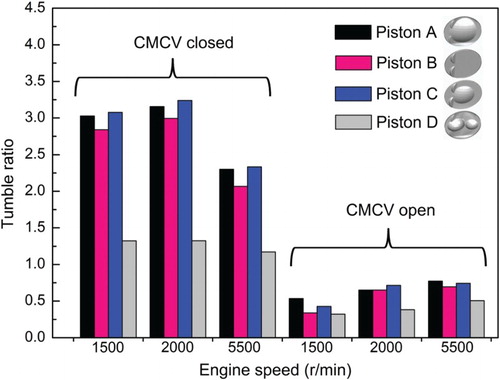
Figure 12. In-cylinder velocity vector plots for the four piston designs (−265 CAD at cut plane B) at: (a) 1500 r/min with the CMCV open, (b) 1500 r/min with the CMCV closed and (c) 2000 r/min with the CMCV closed.
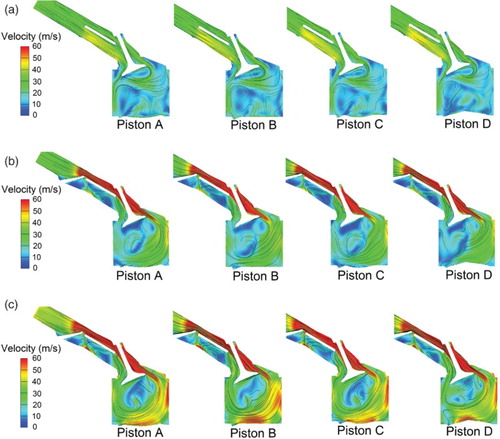
Figure 13. TKE for the four piston designs with both CMCV states at: (a) 1500 r/min, (b) 2000 r/min and (c) 5500 r/min.
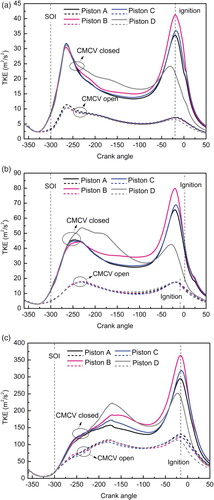
Figure 14. Maximum TKE in the compression stroke for the four piston designs.
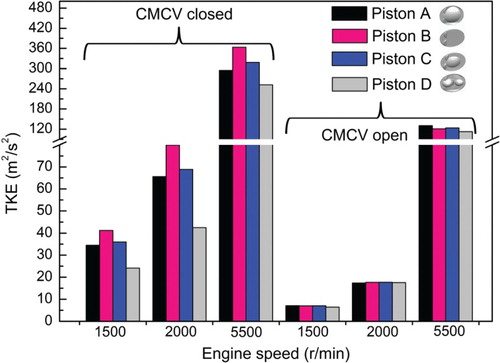
Figure 15. Evaporation curve for the four piston designs at 1500 r/min with: (a) the CMCV open and (b) the CMCV closed.
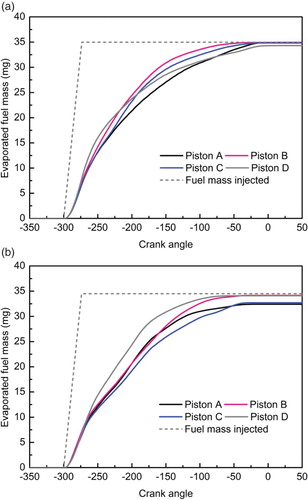
Figure 16. Distribution of the fuel–air equivalence ratio for the four piston designs (−210 CAD at cut planes B, C and E).
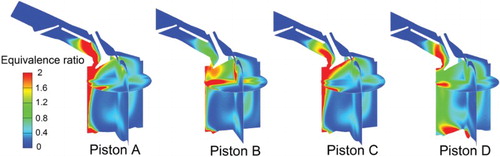
Figure 17. Evaporation curve for the four piston designs at: (a) 2000 r/min and (b) 5500 r/min.
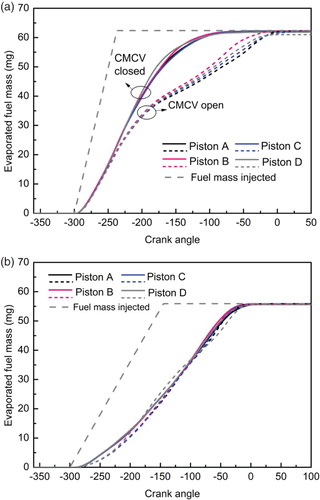
Figure 18. Liquid fuel average value on the piston and cylinder wall for the four piston designs (at 1500 r/min with the CMCV closed).
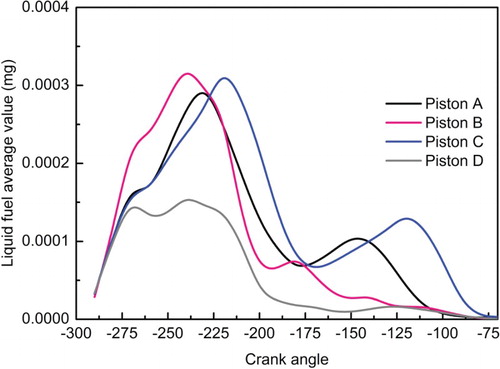
Figure 19. Liquid fuel mass deposit on the four piston design surfaces (−265 CAD at 1500 r/min with the CMCV closed).
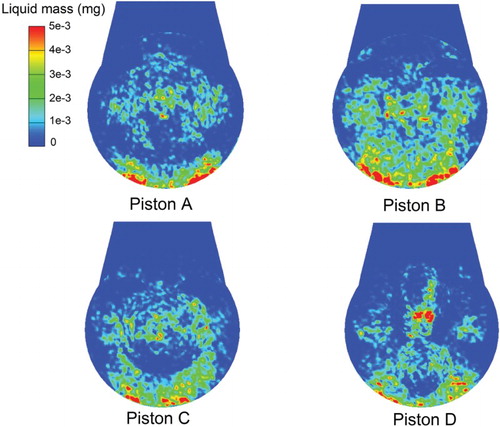
Figure 20. History curve of fuel distribution uniformity and the uniformity value at ignition time for the four piston designs at 1500 r/min: (a) history curve of fuel distribution uniformity and (b) uniformity value at ignition time.
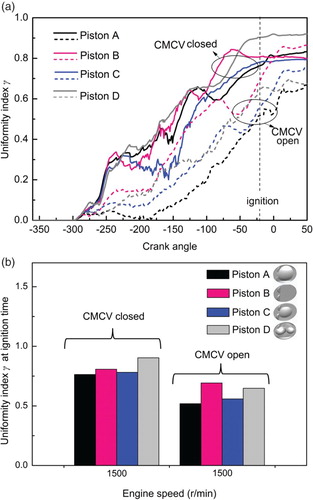
Figure 21. History curve of fuel distribution uniformity and the uniformity value at ignition time for the four piston designs at 2000 r/min: (a) history curve of fuel distribution uniformity and (b) uniformity value at ignition time.
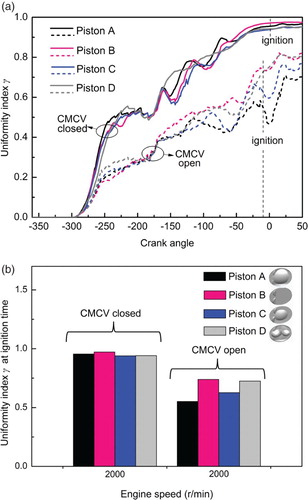
Figure 22. History curve of fuel distribution uniformity and the uniformity value at ignition time for the four piston designs at 5500 r/min: (a) history curve of fuel distribution uniformity and (b) uniformity value at ignition time.
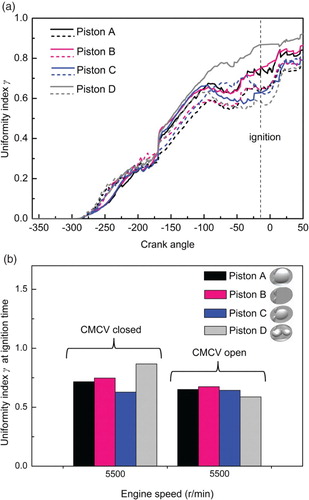
Figure 23. Distribution of the fuel–air equivalence ratio at ignition timing for different speeds (at cut planes A, C and D) at: (a) 1500 r/min with the CMCV open (−20 CAD), (b) 1500 r/min with the CMCV closed (−20 CAD), (c) 2000 r/min with the CMCV closed (2 CAD) and (d) 5500 r/min with the CMCV open (−16 CAD).
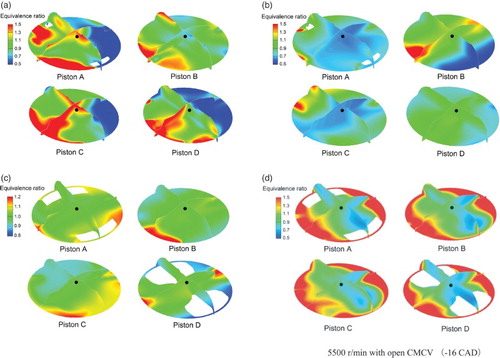
Figure 24. Mean cylinder pressure curve for the four piston designs at 1500 r/min with (a) the CMCV open and (b) the CMCV closed.
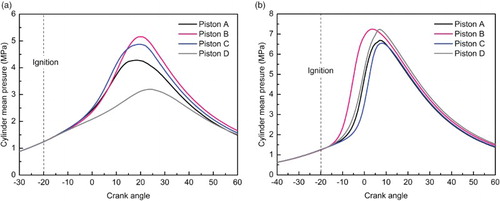
Figure 25. Accumulated heat release curve for the four piston designs at 1500 r/min.
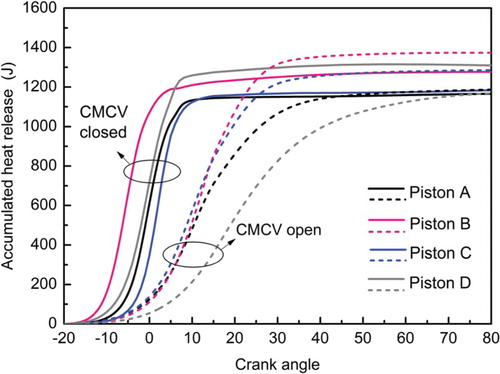
Figure 26. Mean cylinder pressure curves for the four piston designs at 2000 r/min with (a) the CMCV open and (b) the CMCV closed.
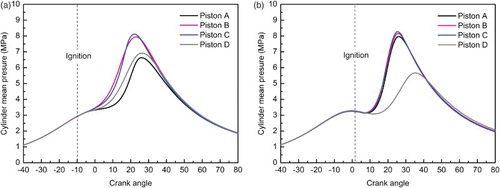
Figure 27. Mean cylinder pressure curves for the four piston designs at 5500 r/min with (a) the CMCV open and (b) the CMCV closed.
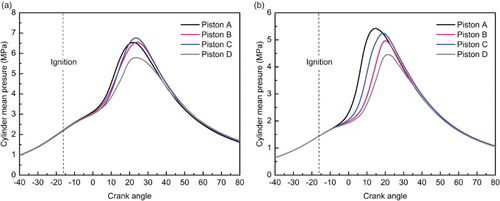
Figure 28. Intake air mass for the four piston designs with both CMCV states.
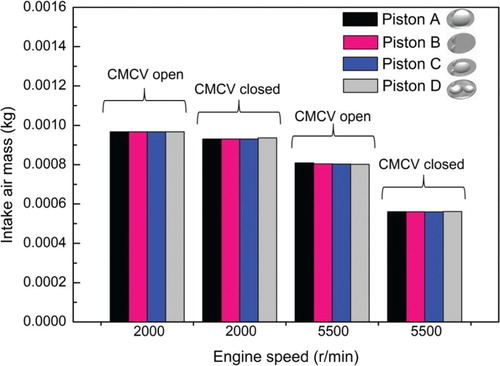
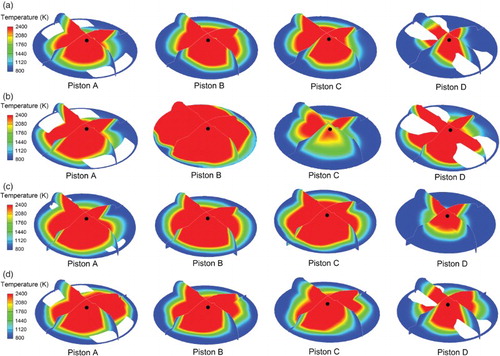
Figure 29. Comparisons of the temperature distribution for the four piston designs (at cut planes A, C and D) at: (a) 1500 r/min with the CMCV open (50 CAD after ignition), (b) 1500 r/min with the CMCV closed (40 CAD after ignition), (c) 2000 r/min with the CMCV closed (40 CAD after ignition) and (d) 5500 r/min with the CMCV open (30 CAD after ignition).