Figures & data
Table 1. Comparison of the film thicknesses and mesh resolutions used for validating the cases in Dai and Wang.
Figure 1. The pressure and velocity fields shown at t=0.0 s (bottom) and t=0.0295 s (top).Note: It is seen that the changes in the curvature of the rear end of the oil slug are a plausible explanation for the increase in the pressure drop. This plot is from the simulations conducted in the present paper.
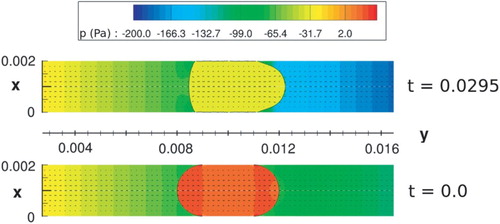
Figure 2. Comparison of the two boundary conditions for the level-set function φ: (a) the zero-Neumann boundary condition and (b) the extrapolation of φ.Note: Both figures are snapshots of the leading edge of the slug at t=0.005 s. The color indicates the pressure field, and the vectors show the velocity field at every fifth point in the x- and y-directions. This plot is from simulations conducted in the present study.
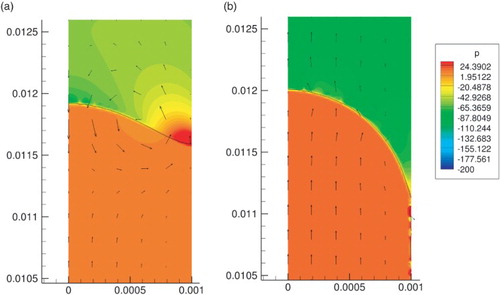
Figure 3. Illustration of the feedback loop that gives rise to the numerical oil film.Note: Figure reprinted from Della Rocca and Blanquart (Citation2014) with permission from Elsevier.
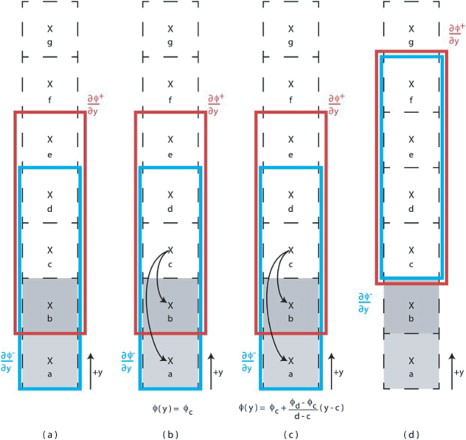
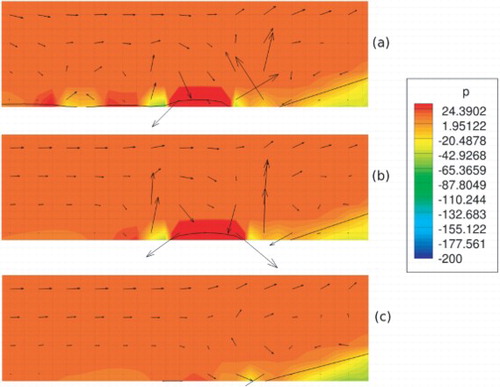
Figure 4. The effect of reinitialization frequency on the development of the thin film around the leading contact point for reinitialization occurring (a) every time step, (b) every 5 time steps and (c) every 20 time steps.Note: A close-up is shown of the contact point at t=0.005 s. These plots are from simulations conducted in the present study.