Figures & data
Figure 1. Velocity triangle at impeller outlet, inlet and outlet of diffuser.
Figure 2. Hydraulic structure of the model pump.
Table 1. Main geometric parameters.
Figure 3. Single-arc design method for the radial diffuser.
Figure 4. 3D model of the flow field calculation domain.
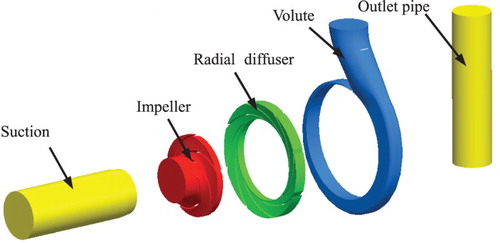
Table 2. The independence check of the mesh.
Figure 5. H-Q curves for different vane outlet angles β4.
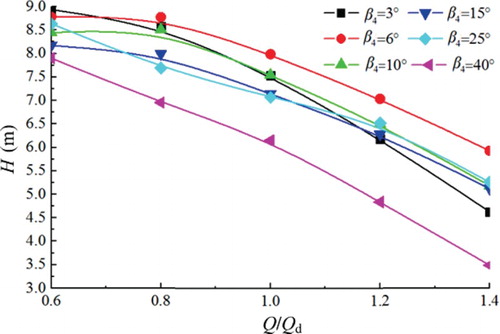
Figure 6. η-Q curves for different vane outlet angles β4.
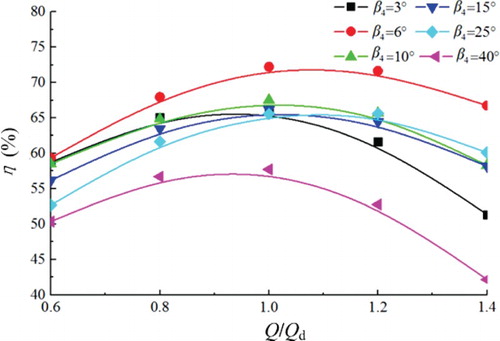
Figure 7. Hydraulic loss in the radial diffuser for different vane outlet angles β4.
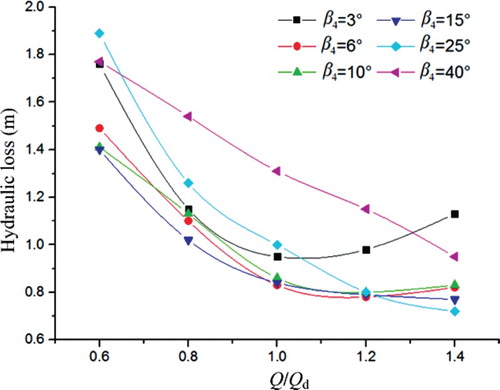
Figure 8. Velocity distribution in the pump middle plane at the design flow rate for: (a) β4 = 3°, (b) β4 = 6°, (c) β4 = 10°, (d) β4 = 15°, (e) β4 = 25°, and (f) β4 = 45°.
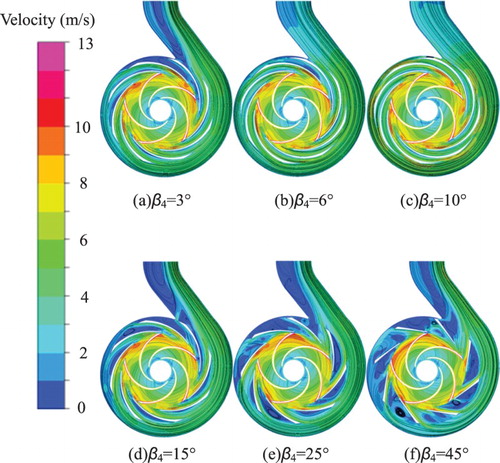
Figure 9. Total efficiency in the pump and the integral hydraulic loss in the radial diffuser and the volute at the design condition.
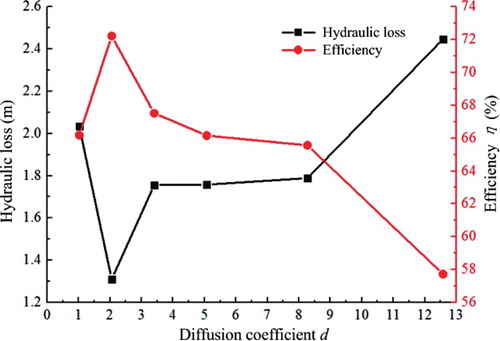
Figure 10. H-Q curves for different vane outlet thicknesses t.
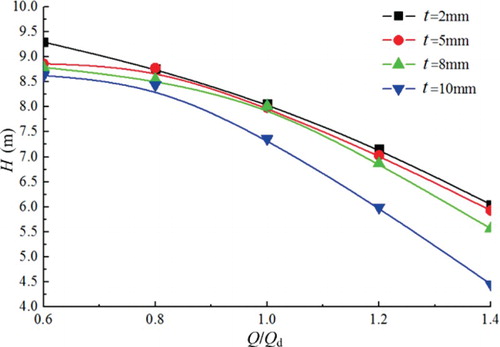
Figure 11. η-Q curves for different vane outlet thicknesses t.
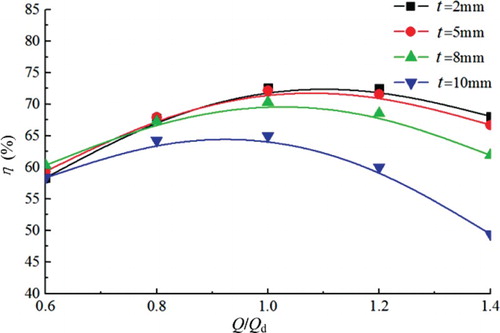
Figure 12. Hydraulic loss in the radial diffuser for different vane outlet thicknesses t.
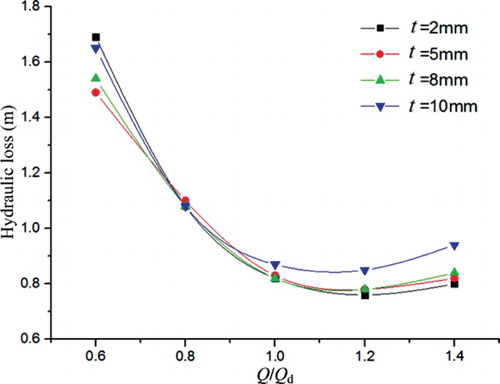
Figure 13. Velocity distribution in the pump middle plane at the design flow rate for: (a) t = 2 mm, (b) t = 5 mm, (c) t = 8 mm, and (d) t = 10 mm.
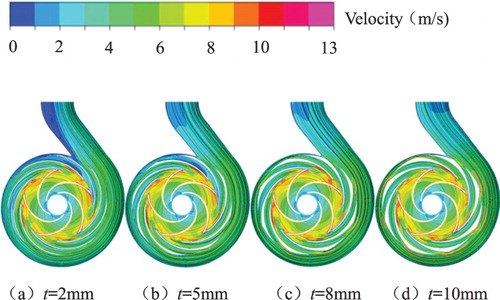
Figure 14. Total efficiency in the pump and the integral hydraulic loss in the radial diffuser and the volute at the design condition.
Figure 15. H-Q curves for different vane numbers ZR.
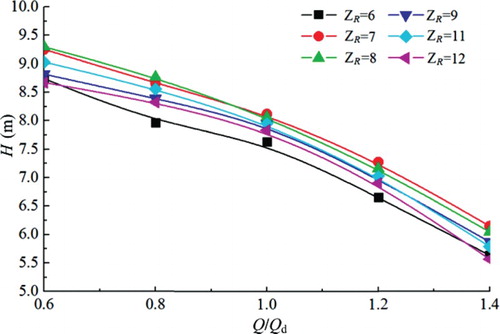
Figure 16. η-Q curves for different vane numbers ZR.
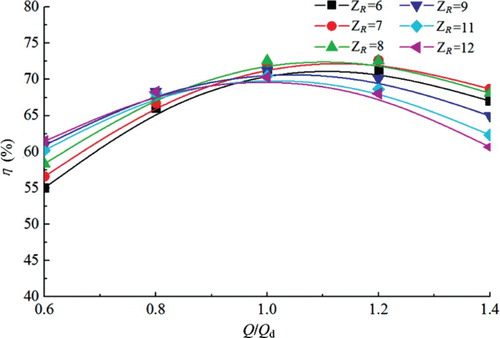
Figure 17. Hydraulic loss in the radial diffuser for different vane numbers ZR.
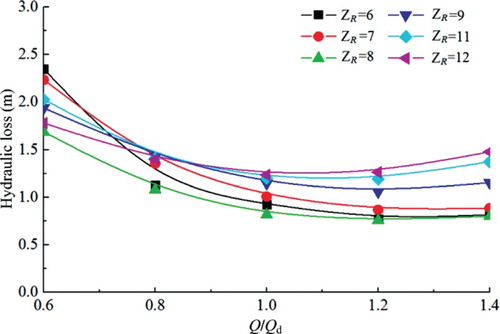
Figure 18. Velocity distribution in the pump middle plane at the design flow rate for: (a) ZR = 6, (b) ZR = 7, (c) ZR = 8, (d) ZR = 9, (e) ZR = 11, and (f) ZR = 12.
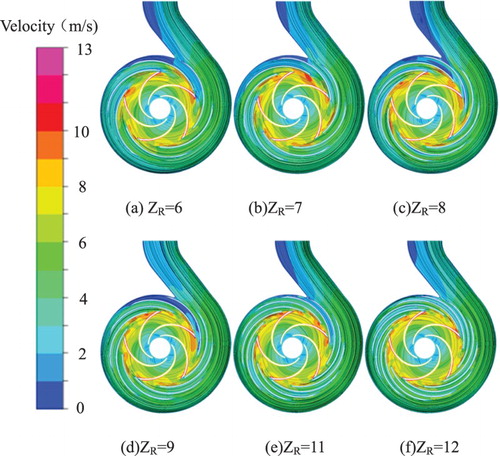
Figure 19. Total efficiency in the pump and the integral hydraulic loss in the radial diffuser and the volute at the design condition.
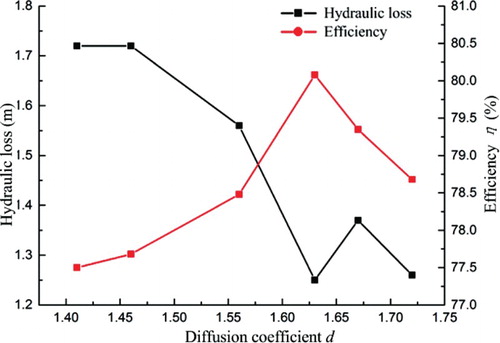
Figure 20. The design contrast between the new and old diffusers.
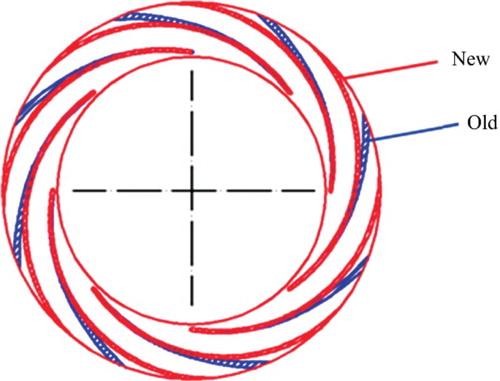
Figure 21. The new radial diffuser.
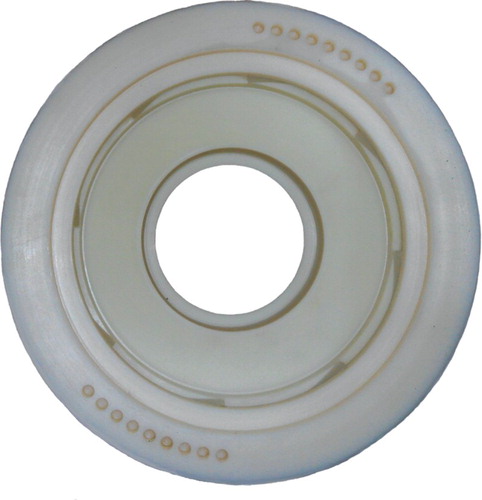
Figure 22. The model pump.
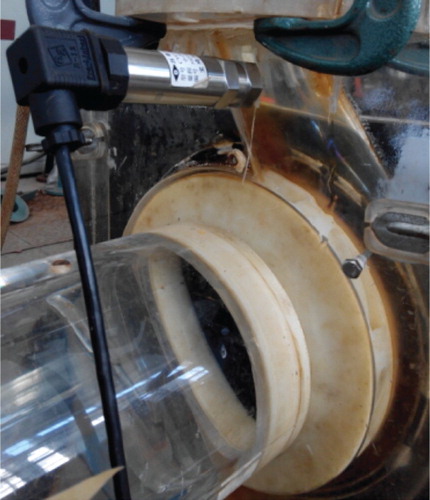
Figure 23. Sketch of the test bed.
Figure 24. Contrast curves between the new model and the primary model.