Figures & data
Figure 1. Centrifugal compressor test facility (test section).
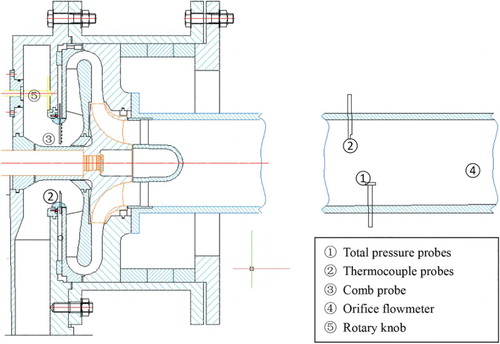
Figure 2. Measuring positions at the outlet of the return channel.
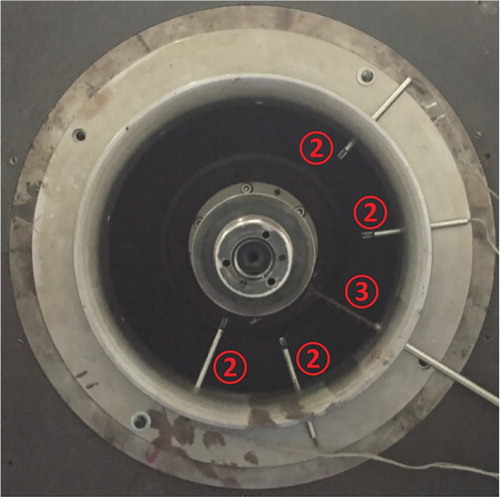
Figure 3. Test probes: (a) total pressure probe, (b) thermocouple probe, and (c) comb probe.
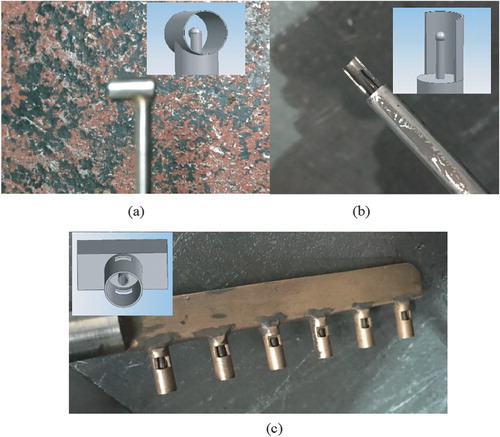
Table 1. Primary geometric information of the centrifugal compressor.
Figure 4. Sketch of the meridional channel.
Figure 5. Grid maps for (a) the impeller and (b) the diffuser.
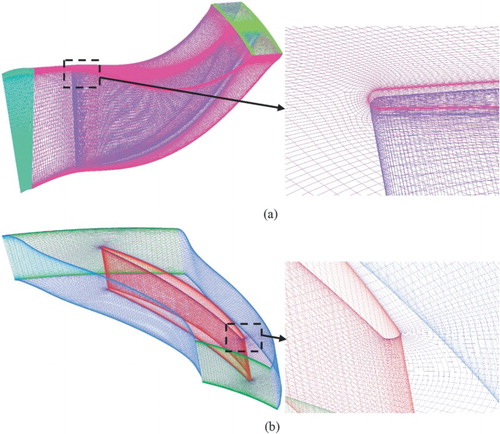
Table 2. Domain grid node numbers.
Figure 6. Comparison of the steady and unsteady results with the experimental data.
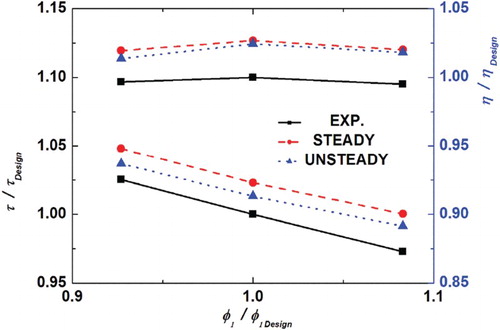
Table 3. Relative errors of efficiency and head coefficient.
Figure 7. Frequency spectrum of the pressure fluctuations at the inlet of the diffuser.
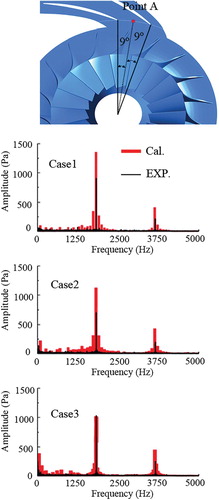
Figure 8. Frequency spectrum of the pressure fluctuations at the outlet of the diffuser.
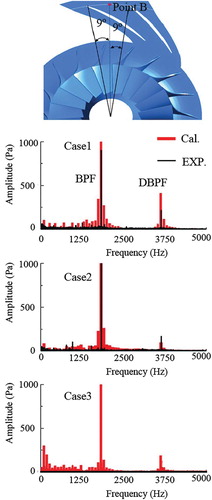
Figure 9. Pressure fluctuations with time for (a) Point A and (b) Point B.
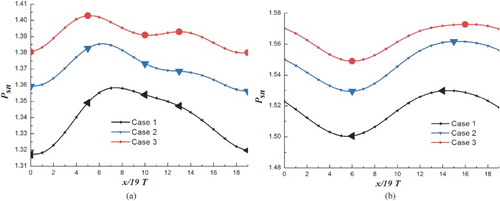
Figure 10. Distributions of PsN at 0/19T: (a) 95% span for Case 1, (b) 50% span for Case 1, (c) 5% span for Case 1, (d) 95% span for Case 3, (e) 50% span for Case 3, and (f) 5% span for Case 3.
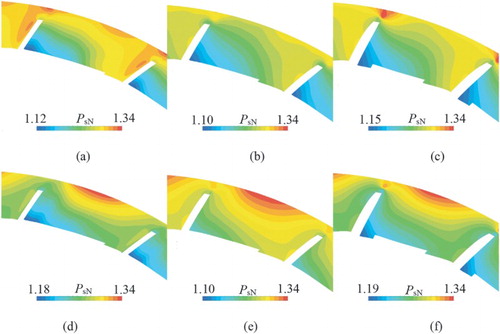
Figure 11. Entropy distribution at 95% span for Case 1 and Case 3.
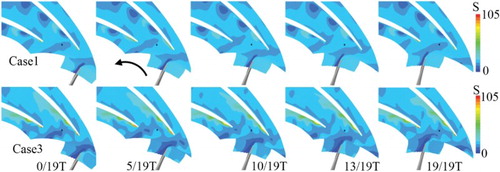
Figure 12. Distributions of flow angles at 95% span for Case 1 and Case 3.
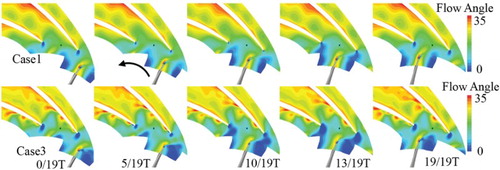
Figure 13. Distributions of streamline at 95% span at 13/19T for: (a) Case 1 and (b) Case 3.
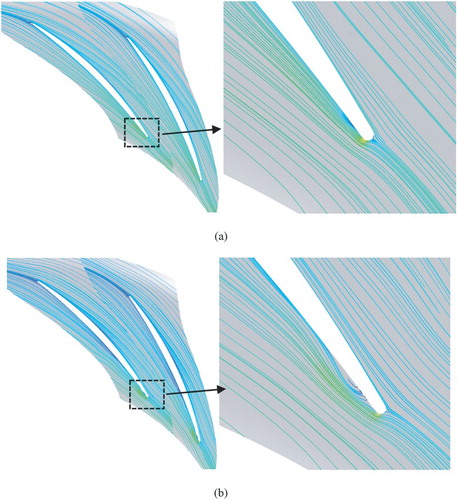
Figure 14. Vortex core regions within the diffuser passage for: (a) Case 1, (b) Case 2, and (c) Case 3.
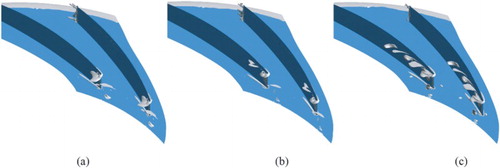
Figure 15. Case 3 at 95% span of diffuser inlet (R/R2 = 1.04): (a) pressure distribution and (b) flow angle distributions.
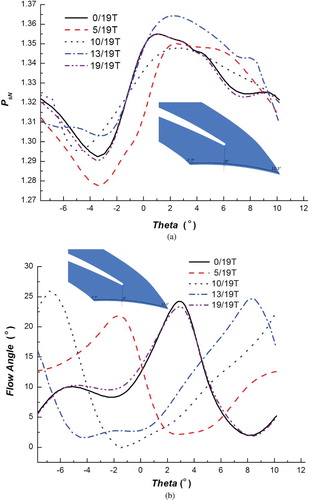
Figure 16. (a) total pressure loss coefficient Cpt of diffuser and (b) static pressure recovery coefficient Cps of diffuser.
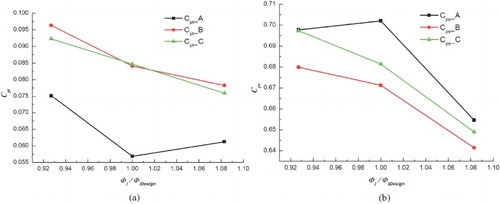
Figure 17. Loading distributions of the diffuser vane for Case 3 at: (a) 10% span, (b) 50% span, and (c) 90% span.