Figures & data
Table 1. Parameters.
Table 2. Optimization results of different algorithms.
Figure 1. Convergence history of the different algorithms (a) f1(x), (b) f2(x), (c) f3(x), (d) f4(x).
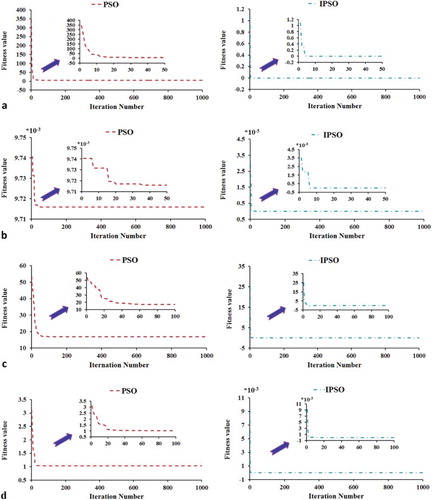
Figure 2. Geometry deformation using two parameters.
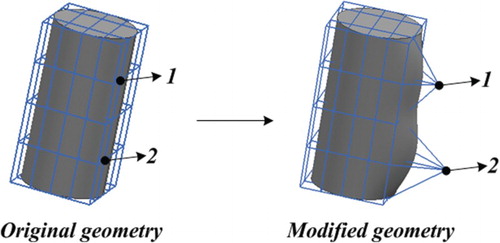
Figure 3. Grid division of computational domain and hull (a) Mesh of the computational domain, (b) Computational mesh on the ship geometries.
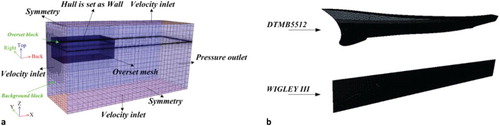
Figure 4. Comparison of samples (a) Random latin hypercube design, (b) Optimal latin hypercube design (above: Present study, below: Wang & Lu, Citation2015).
Figure 5. Space distributions of samples (a) DTMB5512, (b) WIGLEYIII.
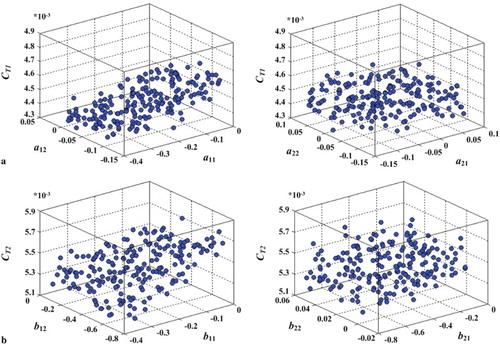
Table 3. Experiment samples.
Figure 6. The framework of ElmanNN (above: Present study, below: Wang et al., Citation2011).
Figure 7. Prediction results of CT1 for DTMB5512ship (a) The prediction of the CT1using ElmanNN, (b) The prediction of the CT1using IPSO-ElmanNN.
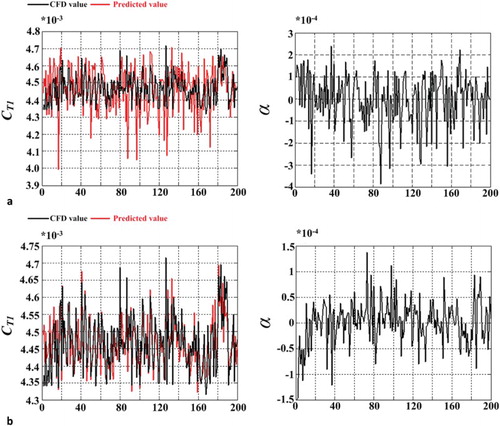
Figure 8. Prediction results of CT2 for WIGLEYIIIship (a) The prediction of the CT2using ElmanNN, (b) The prediction of the CT2using IPSO-ElmanNN.
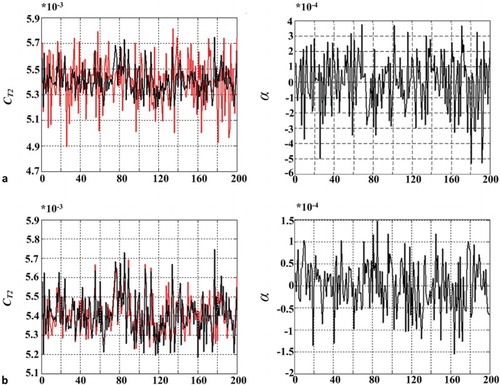
Table 4. Result of the total resistance coefficient prediction based on the different algorithms.
Figure 9. Flow chart of the optimization loop.
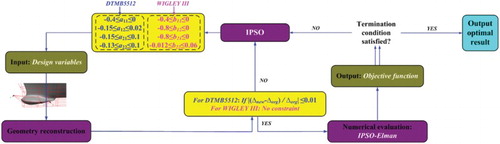
Figure 10. Modified region of hull forms.
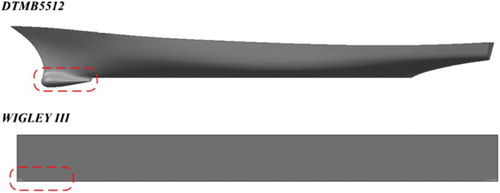
Table 5. Major characteristics of two ships.
Table 6. Control parameters of two ships.
Figure 11. Control positions of two ships.
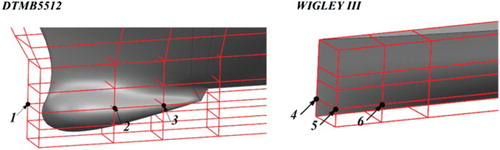
Figure 12. The total resistance coefficients for a range of Fr numbers (a) DTMB5512, (b) WIGLEYIII.
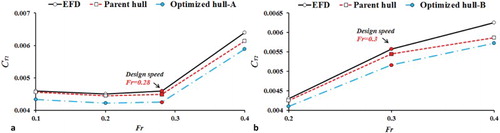
Table 7. Resistance results of the optimized hulls.
Figure 13. Comparison of hull lines (a) DTMB5512, (b) WIGLEYIII.
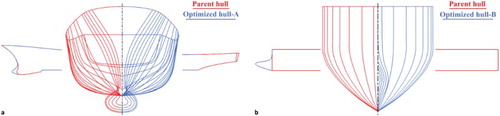
Figure 14. Comparison of wave profile at y/Lpp = 0.082 (a) DTMB5512, (b) WIGLEYIII.
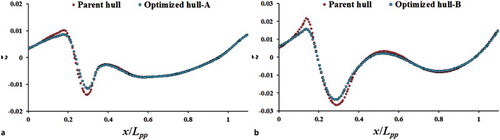
Figure 15. Comparison of the wave patterns around the vessels (a) DTMB5512, (b) WIGLEYIII.
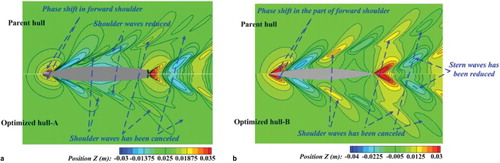
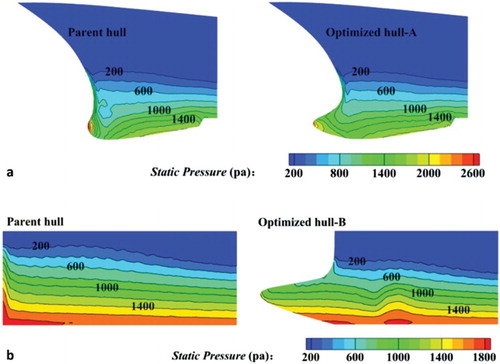
Figure 16. Comparison of the static pressure on the ship surfaces (a) DTMB5512, (b) WIGLEYIII.