Figures & data
Figure 1. A schematic of the fluidic oscillator and computational domain.
Figure 2. Geometric parameters.
Figure 3. Optimization procedure.
Table 1. Design space.
Figure 4. Grid dependency test for frequency of flow oscillations at the feedback channel of the reference fluidic oscillator (Jeong & Kim, Citation2016).
Figure 5. Validation of numerical results with three turbulence models using experimental data for the frequency of flow oscillation (Jeong & Kim, Citation2016).
Table 2. Design variables and objective function values at all the LHS design points.
Figure 6. Pareto-optimal fronts with RSA and KRG models.
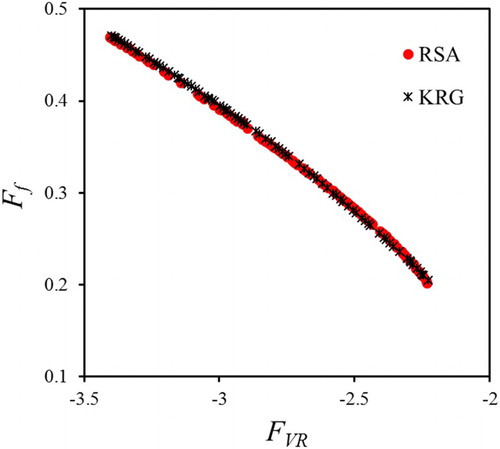
Figure 7. Representative Pareto-optimal designs.
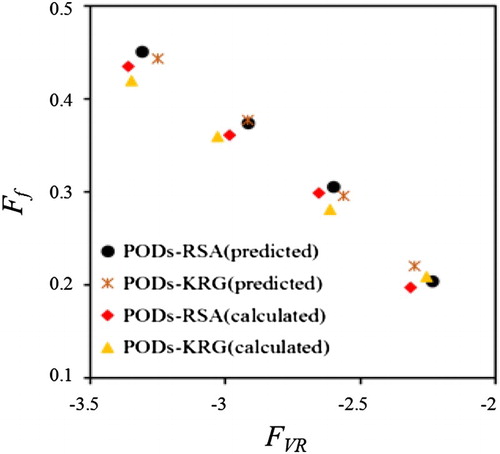
Table 3. Design variables and objective function values at four cluster points and the reference design.
Figure 8. Frequency of flow oscillation at the feedback channels.
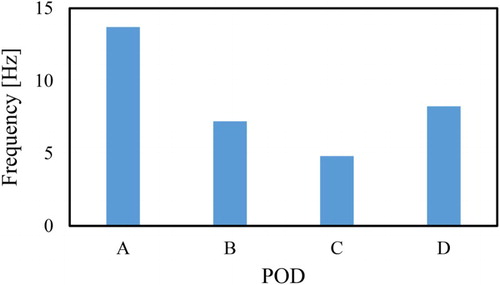
Figure 9. Time-resolved mass flow rate through a right-hand side feedback channel for the PODs.
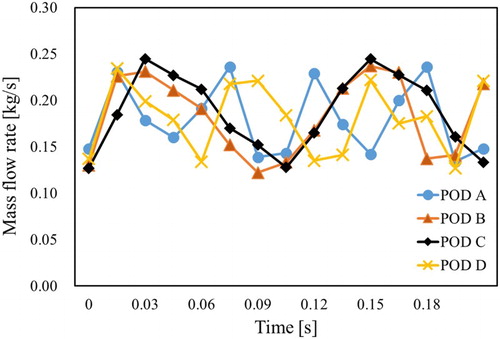
Table 4. Time-averaged mass flow rate through the right-hand side feedback channel for the PODs.
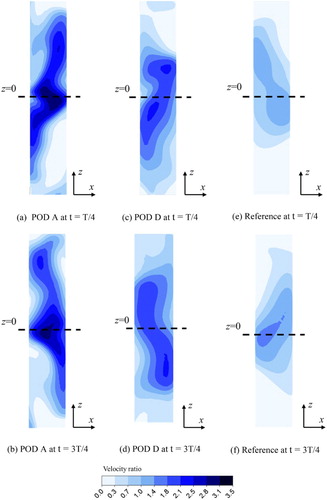
Figure 10. Local velocity ratio distributions and velocity vectors at t = T/4 and 3T/4 on the central x-y plane (z = 0) for POD A, POD D, and the reference design.
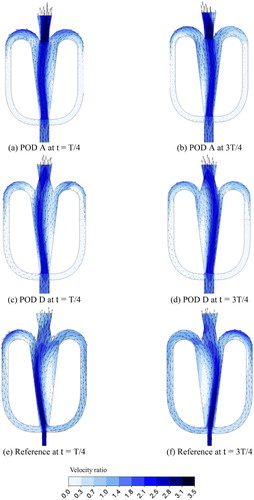
Figure 11. Vorticity (ωz) distributions at t = T/4 on the central x-y plane (z = 0) for POD A, POD D, and the reference design.
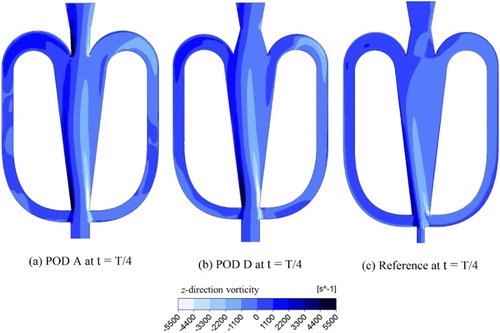
Figure 12. Local velocity ratio distributions and streamlines at t = T/4 on the cross-sectional plane A-A’.
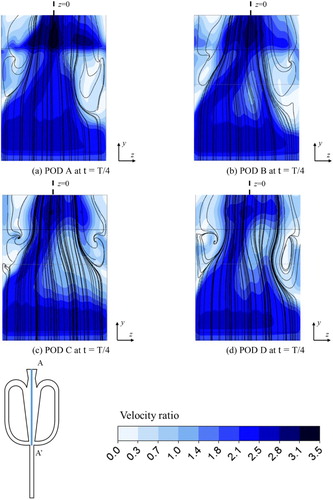
Figure 13. Local velocity ratio distributions at t = T/4 and 3T/4 on outlet plane for POD A, POD D, and the reference design.