Figures & data
Figure 1. Flow chart illustrating development of soot estimator library.
Table 1. Burner dimensions and flow conditions of fuel and air streams for experiments gathered (Santoro et al., Citation1983; Smooke et al., Citation2005; Smyth & Shaddix, Citation1996).
Figure 2. Illustration of Lagrangian parcel-tracking post-processor calculating instantaneous temperature along the pathline of a soot-containing fluid parcel. Left side: temperature contours of a laminar ethylene coflow diffusion flame. Right side: Plot of local temperature the soot-containing fluid parcel is exposed to along its pathline.
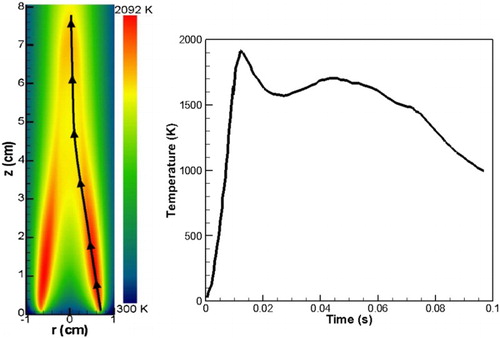
Figure 3. Flow chart illustrating utilization of soot estimator library.
Figure 4. Time required to generate a library and the number of data entries in that library versus the number of bins used.
Figure 5. Comparison of experimentally-validated CFD computed soot concentrations with those predicted by the estimator library for the Santoro et al. (Citation1983) flame along the streamline of maximum soot (left) and the flame centerline (right).
Figure 6. Comparison of CFD computed soot concentrations with those predicted by the estimator library for the Smyth48 (1996) flame along the streamline of maximum soot (left) and the flame centerline (right).
Table 2. Differences (%) between CFD computed peak soot concentrations with those predicted by a post-processor library (four parameters – 40 bins) for the streamline of maximum soot for various flame data tested among broadening libraries.
Figure 7. Comparison of CFD computed soot concentrations with those predicted by the estimator library of 40 bins (four parameters) for the Smyth48 flame (Smyth & Shaddix, Citation1996) with no soot formation along the streamline of maximum soot.
Table 3. Differences (%) between CFD computed peak soot concentrations with those predicted by a post-processor library (four parameters – 100 bins) for the streamline of maximum soot for various flame data tested among broadening libraries.
Figure 8. Comparison of CFD computed soot concentrations with those predicted by the estimator library of 100 bins (four parameters) for the Smyth48 flame (Smyth & Shaddix, Citation1996) with no soot formation along the streamline of maximum soot.
Table 4. Differences (%) between CFD computed peak soot concentrations with those predicted by a post-processor library (five parameters – 40 bins) for the streamline of maximum soot for various flame data tested among broadening libraries.
Figure 9. Comparison of CFD computed soot concentrations with those predicted by the estimator library of 40 bins (five parameters) and 40 bins (four parameters) for the Smyth48 flame (Smyth & Shaddix, Citation1996) with no soot formation along the streamline of maximum soot.