Figures & data
Table 1. Comparison of several system (Mehdidoust & Shahbahrami, Citation2016).
Figure 1. C value.
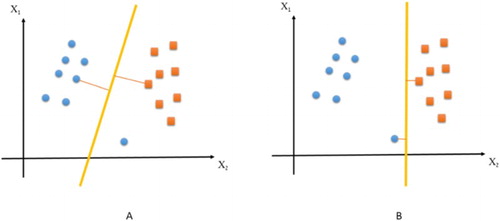
Figure 2. -tube (Insom et al., Citation2015)
Figure. 3. Data flow related to the proposed method
Table 2. Parameters set in proposed method.
Figure 4. The earthquakes recorded within the studied area (www.irsc.ut.ac.ir)
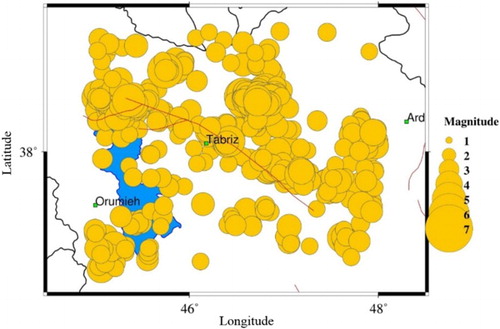
Table 3. Collected data details.
Figure 5. The comparison of actual and estimated values for mean magnitude.
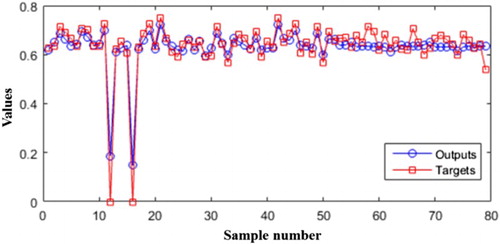
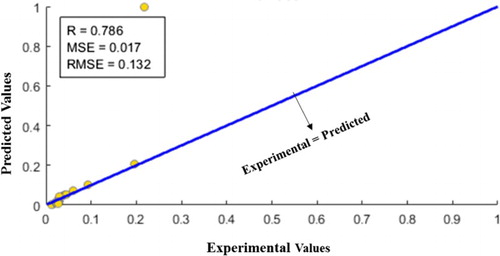
Figure 6. Coincidence of estimated mean magnitude of earthquakes (R index).
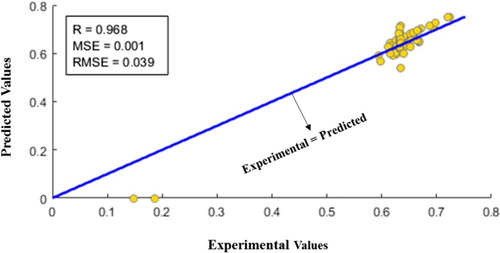
Figure 7. The comparison of actual and estimated number of earthquakes.
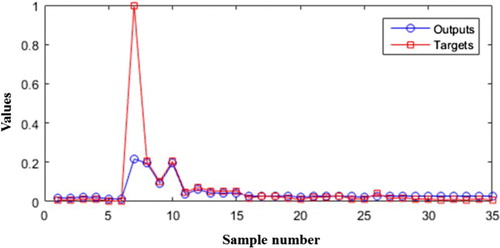
Figure 8. The coincidence of estimated number of earthquakes (R index).