Figures & data
Figure 1. Location of the study area.
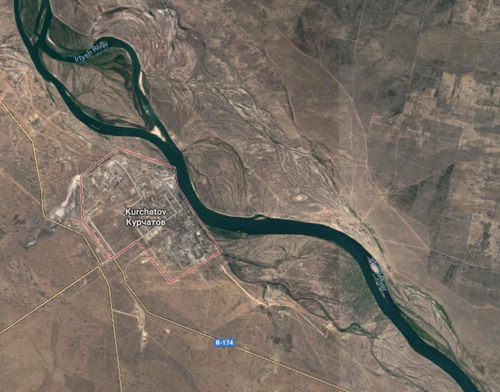
Figure 2. Geometry and boundary conditions of the test problem.
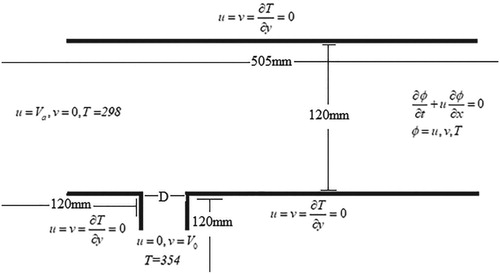
Figure 3. Temperature change profiles for different grid sizes and for different turbulent models.
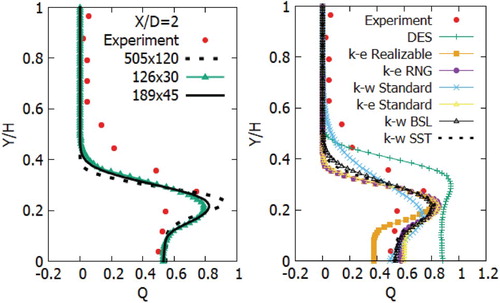
Table 1. Calculation duration and various norms of different turbulent models.
Figure 4. Distribution of temperature in the open channel.
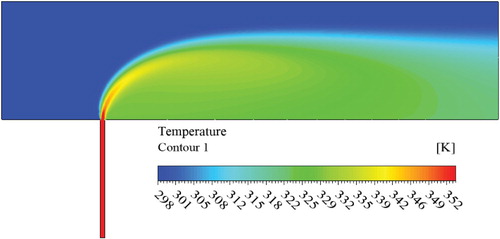
Figure 5. Temperature profiles for different cross sections.
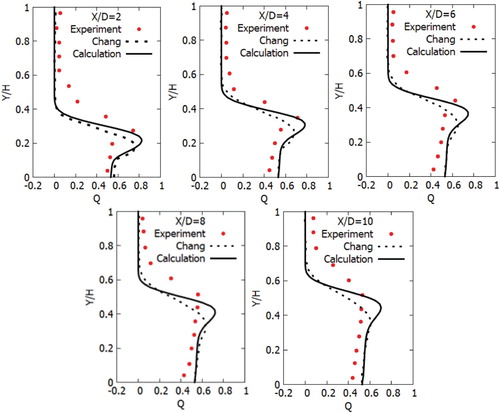
Figure 6. Geometry and boundary conditions.
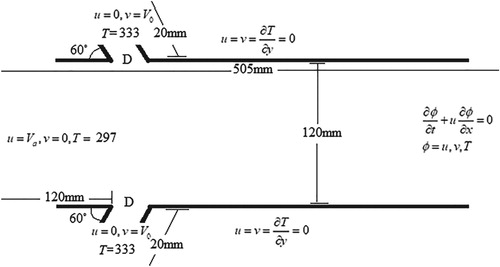
Figure 7. Contours of temperature propagation for oppositely directed transverse flows at an angle of .
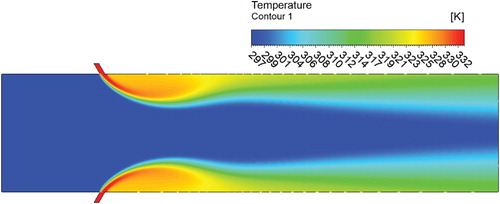
Figure 8. Horizontal velocity profiles for different sections ().
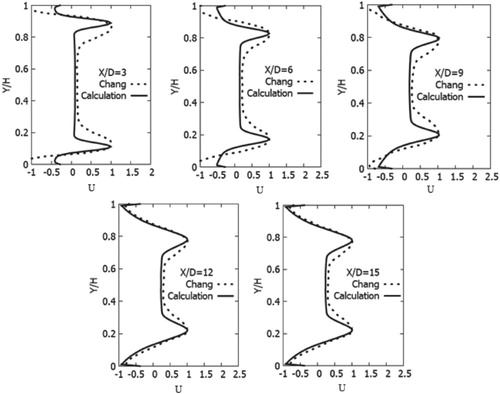
Figure 9. Geometry and boundary conditions.
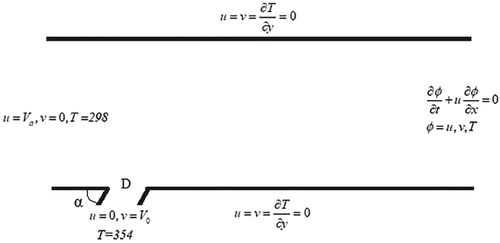
Figure 10. Dimensionless temperature profiles for the vertical cross section at different angles (
) of the transverse channel.
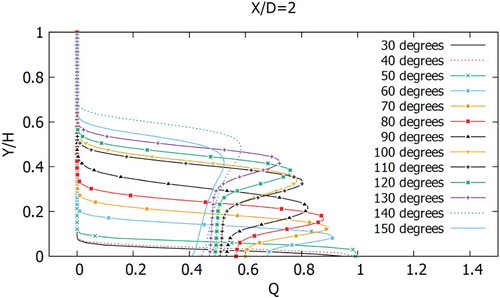
Figure 11. Dimensionless temperature profiles for the vertical cross section at different angles (
) of the transverse channel.
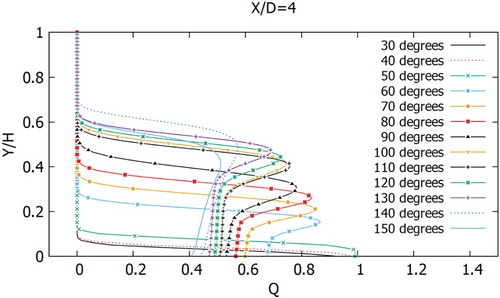
Figure 12. Dimensionless temperature profiles for the vertical cross section at different angles (
) of the transverse channel.
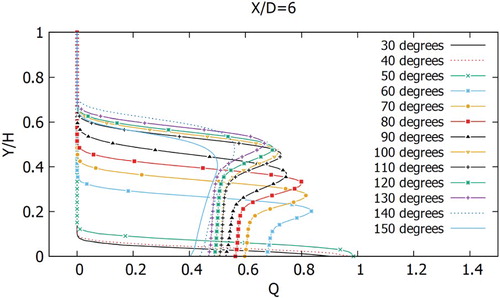
Figure 13. Dimensionless temperature profiles for the vertical cross section at different angles (
) of the transverse channel.
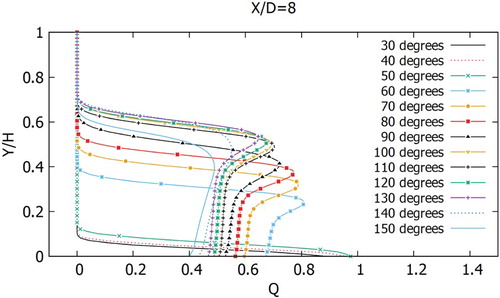
Figure 14. Dimensionless temperature profiles for the vertical cross section at different angles (
) of the transverse channel.
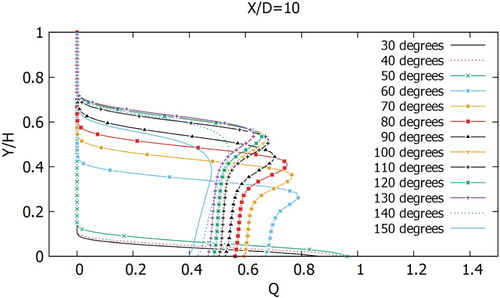
Figure 15. Dimensionless horizontal velocity component profiles for the vertical cross section at different angles (
) of the transverse channel.
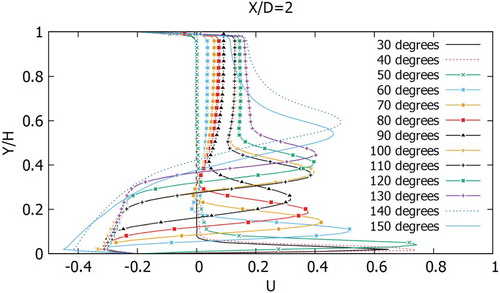
Figure 16. Dimensionless horizontal velocity component profiles for the vertical cross section at different angles (
) of the transverse channel.
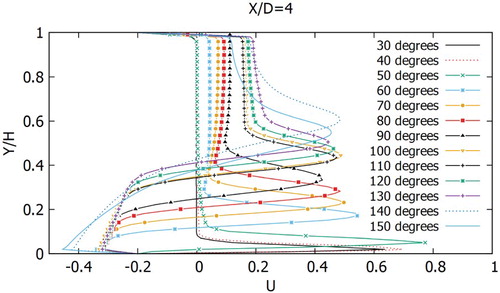
Figure 17. Dimensionless horizontal velocity component profiles for the vertical cross section at different angles (
) of the transverse channel.
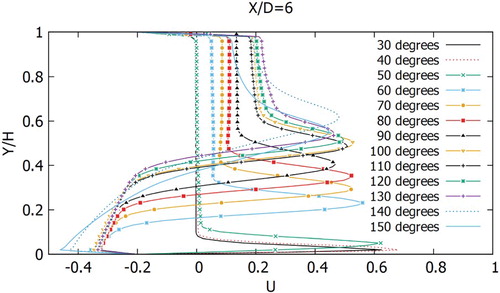
Figure 18. Dimensionless horizontal velocity component profiles for the vertical cross section at different angles (
) of the transverse channel.
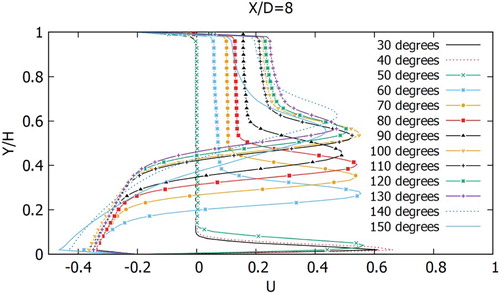
Figure 19. Dimensionless horizontal velocity component profiles for the vertical cross section at different angles (
) of the transverse channel.
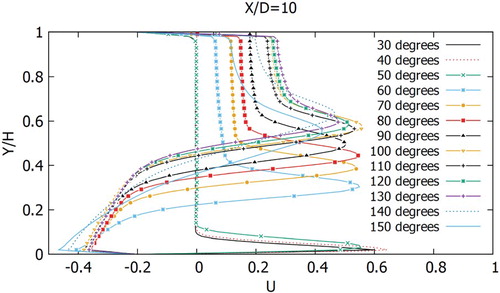
Figure 20. Calculation area.
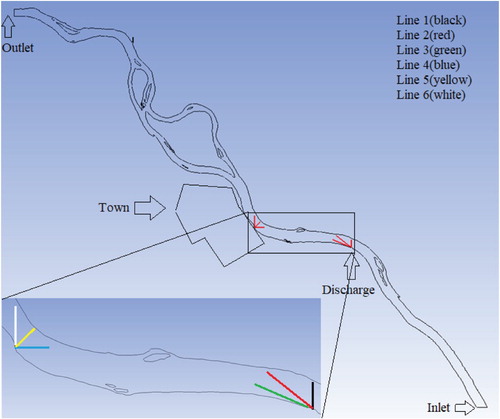
Table 2. Parameters used in the main scenarios.
Figure 21. Temperature profiles on the first line for different computational meshes.
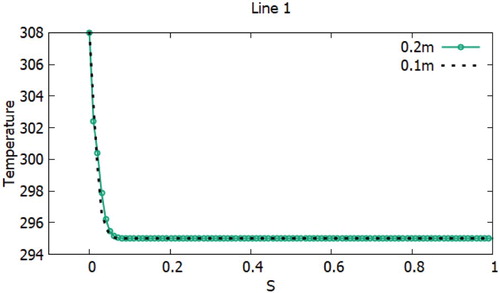
Figure 22. Distribution of heated water at discharge rate 2 m/s from the water discharge channel (scenario 1).
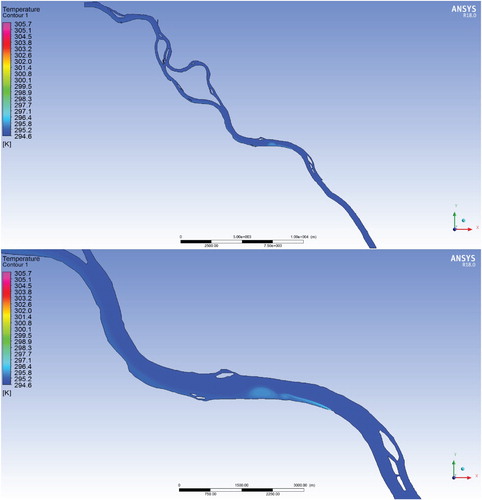
Figure 23. Distribution of heated water at discharge rate 2 m/s from the water discharge channel (scenario 1).
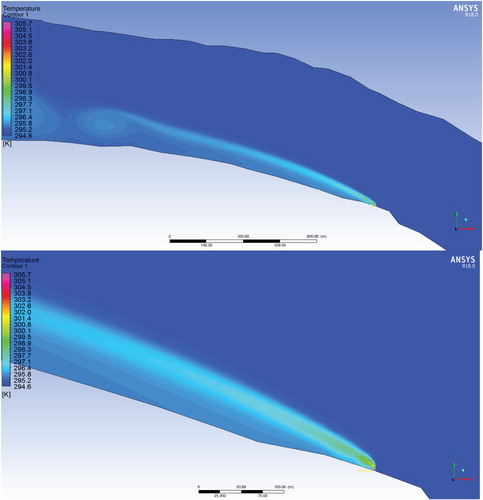
Figure 24. Distribution of heated water at discharge rate 4 m/s from the water discharge channel (scenario 2).
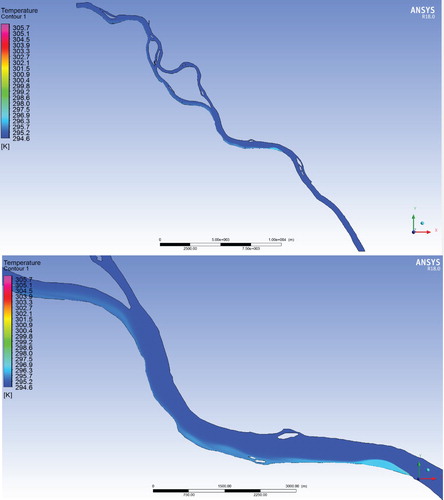
Figure 25. Distribution of heated water at discharge rate 4 m/s from the water discharge channel (scenario 2).
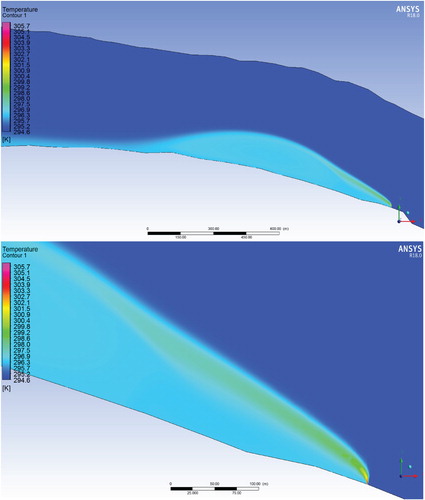
Figure 26. Distribution of heated water at discharge rate 8 m/s from the water discharge channel (scenario 3).
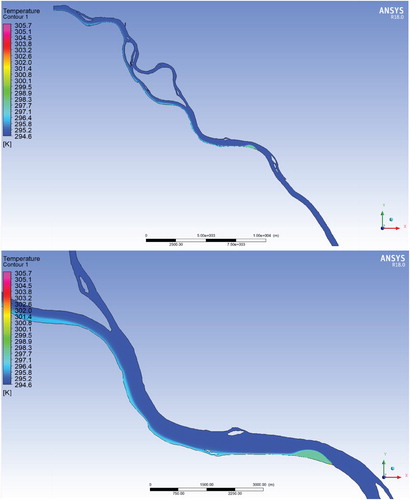
Figure 27. Distribution of heated water at discharge rate 8 m/s from the water discharge channel (scenario 3).
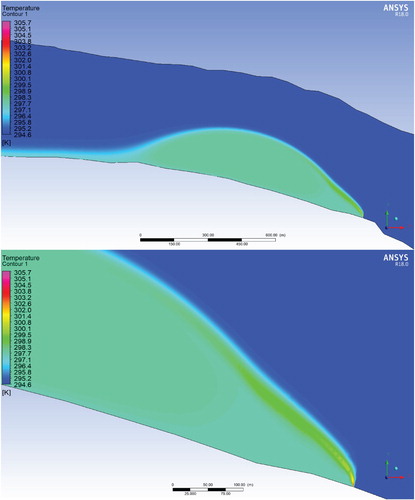
Figure 28. Area of heated water zones on the river (), where discharged the heated water temperature exceeds the ambient temperature of the aquatic environment.
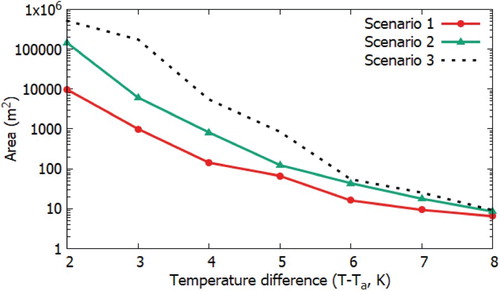
Figure 29. Temperature profiles on the first line for three scenarios.
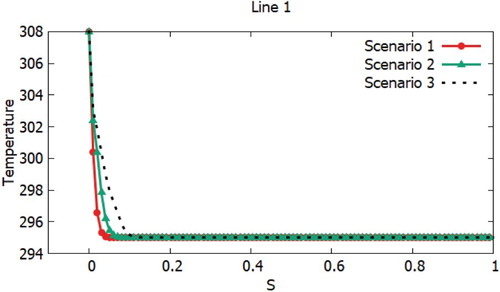
Figure 30. Temperature profiles on the second line for three scenarios.
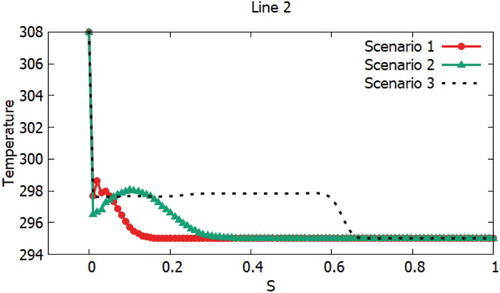
Figure 31. Temperature profiles on the third line for three scenarios.
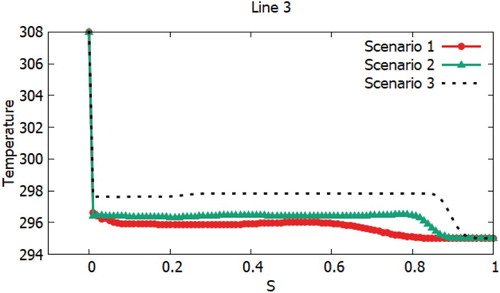
Figure 32. Temperature profiles on the fourth line for three scenarios.
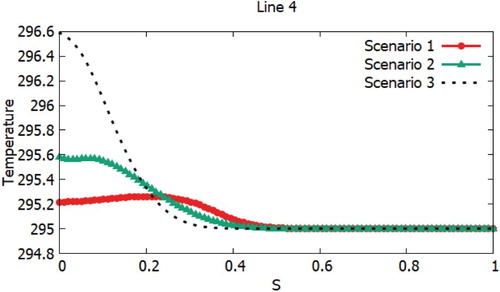
Figure 33. Temperature profiles on the fifth line for three scenarios.
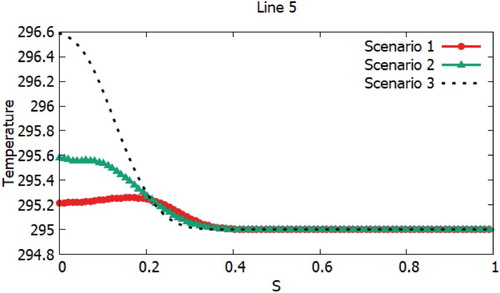
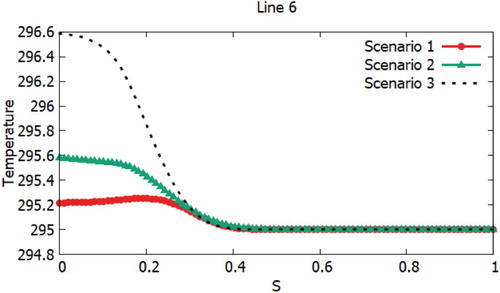
Figure 34. Temperature profiles on the sixth line for three scenarios.