Figures & data
Figure 1. Schematic diagram of indirect evaporative cooler with various configurations: (a) HMX A; (b) HMX B; (c) HMX C; (d) HMX D; (e) HMX E.
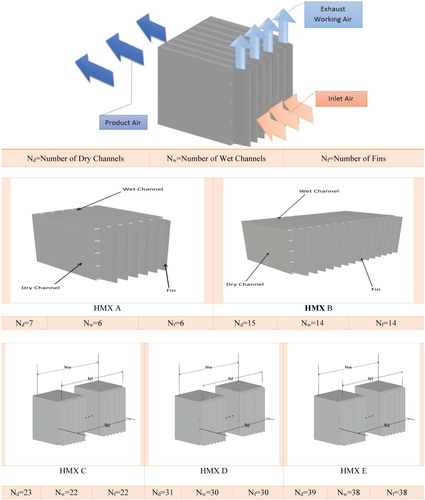
Table 1. Specifications of the parameters used in the experiment.
Figure 2. Photographic view of the actual HMX.
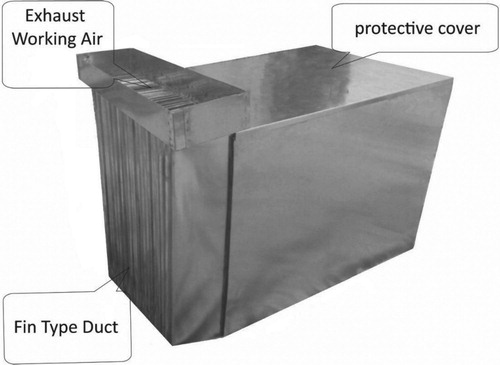
Figure 3. The schematic diagram of the constructed indirect evaporative experimental set-up.
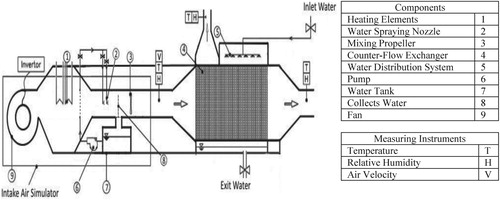
Table 2. Specification of measuring devices.
Figure 4. Schematic of the counter-flow regenerative and differential control volumes.
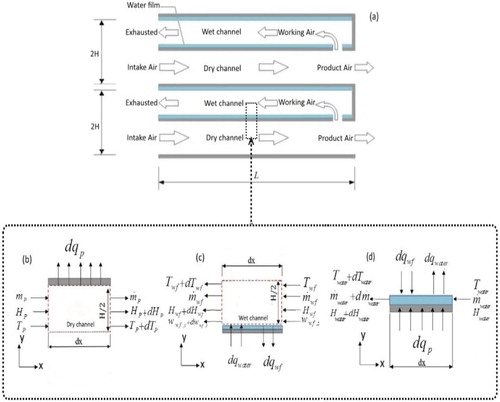
Figure 5. Comparison of numerical results with the experimental values of Riangvilaikul and Kumar (Citation2010a) for product air temperature with various inlet air conditions.
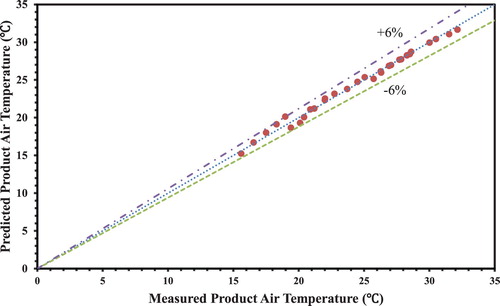
Figure 6. Comparison of numerical results with the present experimental values for product air temperature with various inlet air conditions.
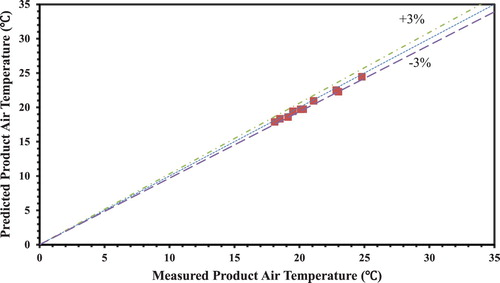
Figure 7. Product cooling air temperature for various inlet air conditions.
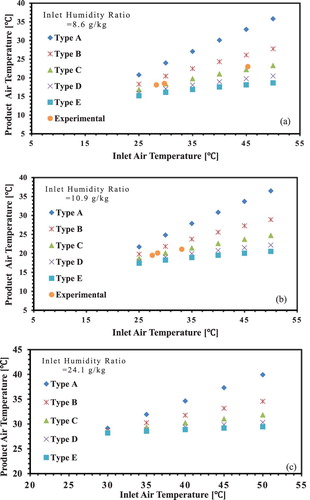
Figure 8. Wet-bulb effectiveness for various inlet air conditions.
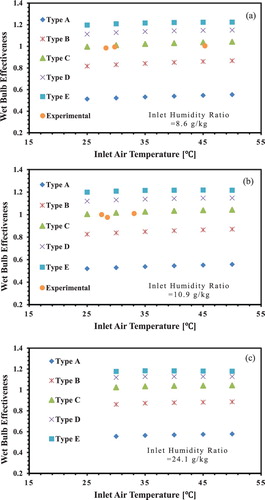
Figure 9. Dew-point effectiveness for various inlet air conditions.
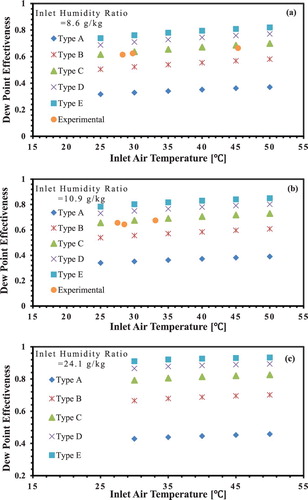
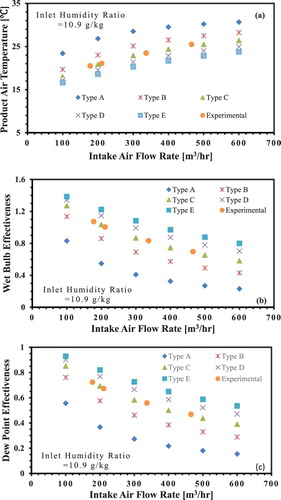
Figure 10. Effect of inlet air flow rate on (a) product cooling air temperature, (b) wet-bulb effectiveness, and (c) dew-point effectiveness in theoretical and experimental studies.