Figures & data
Figure 1. Schematics of the computational model.
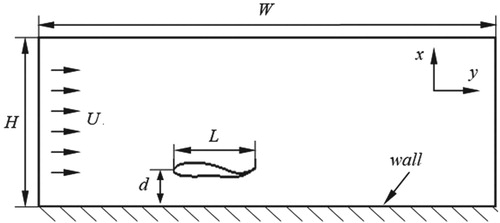
Figure 2. NACA0012 foil simulation model.
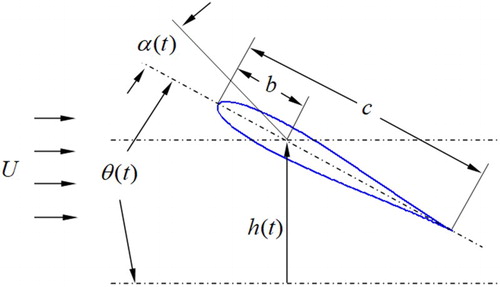
Figure 3. Comparison of the present result and previous data for the (a) average thrust coefficient and (b) propulsion efficiency.
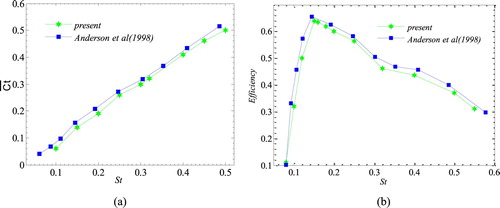
Figure 4. The time-varying drag coefficient curves over three cycle using different grids.
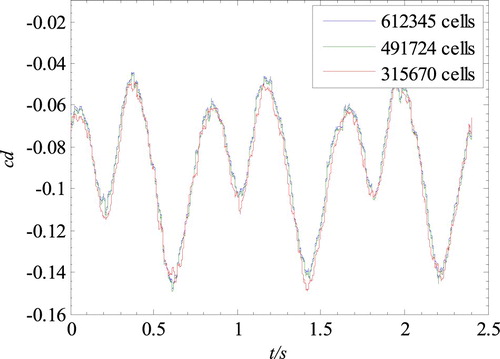
Table 1. Simulation parameters arrangement (d = ∞ denotes out of wall effect case).
Figure 5. The mean (a) thrust , (b) lift
, (c) moment
coefficients and (d) power extraction efficiency η against Strouhal numbers St at different clearance d.
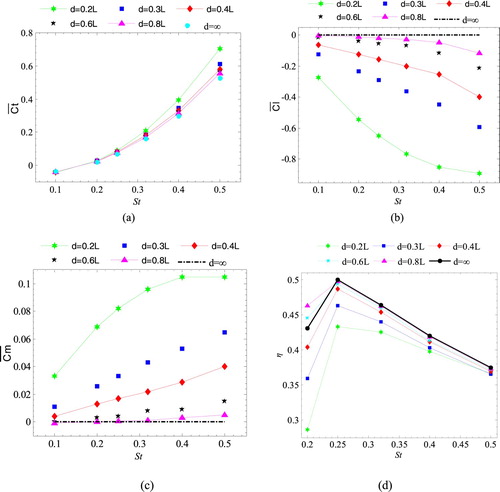
Figure 6. Instantaneous vorticity contours against Strouhal number St at (a) d = 0.2L and (b) d = 10L.
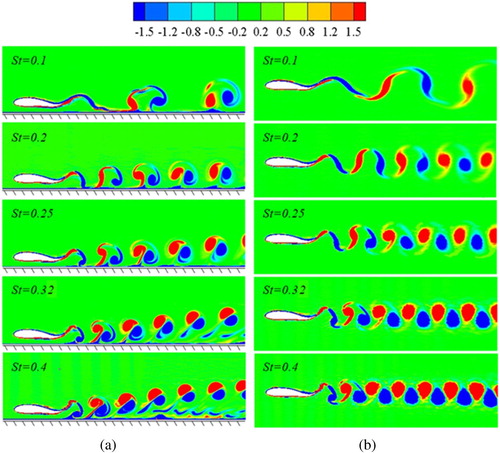
Figure 7. The mean (a) thrust , (b) lift
, (c) moment
coefficients and (d) power extraction efficiency η against wavelength λ at different clearance d.
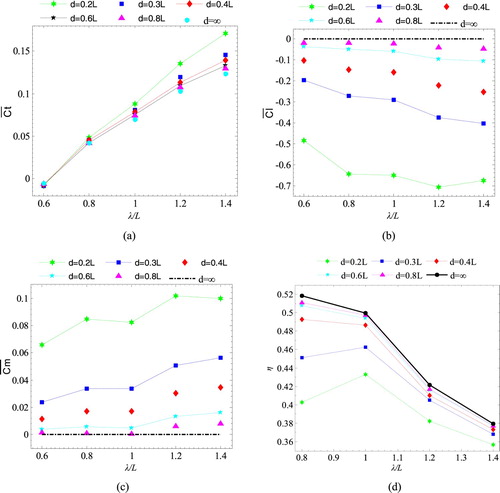
Figure 8. Vorticity distribution under difference wavelength λ at (a) d = 0.2L and (b) d = 10L.
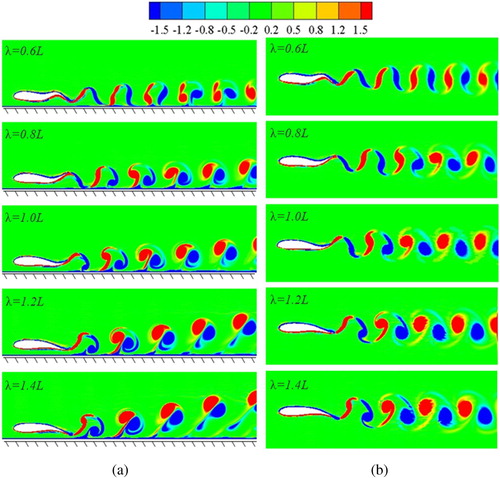
Figure 9. The time-varying (a)(b) drag coefficient cd, (c)(d) lift coefficient cl and (e)(f) moment coefficient cm.
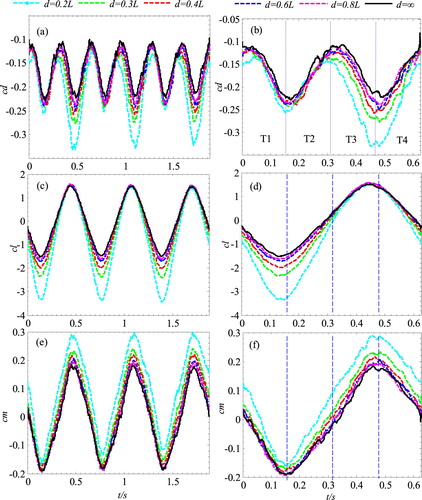
Figure 10. Vorticity distribution in one undulating cycle.
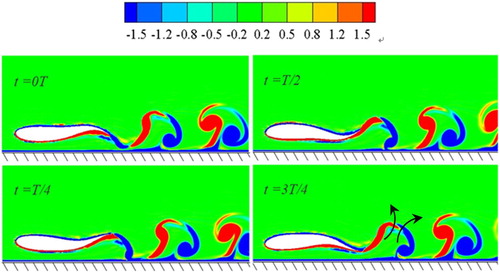
Figure 11. Pressure contours distribution around the fishlike foil.
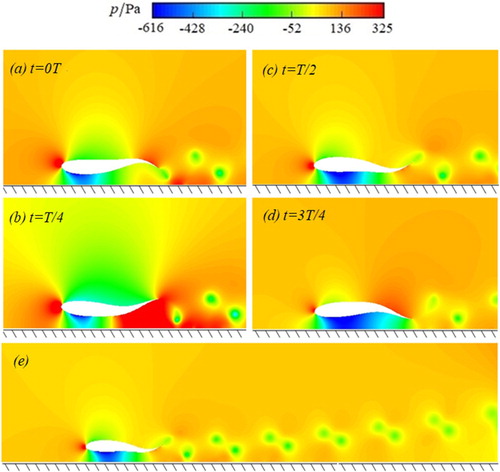
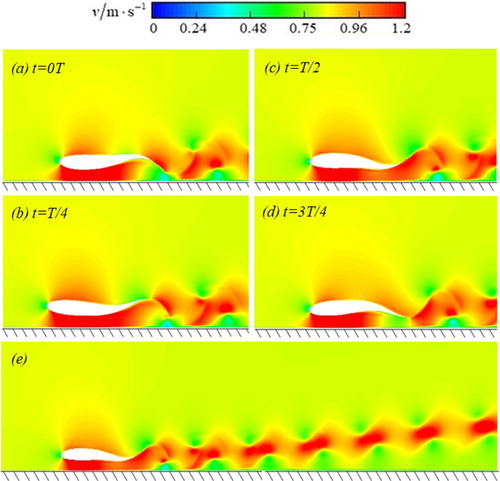
Figure 12. Velocity contours distribution around the fishlike foil.