Figures & data
Figure 1. Computational domain and the boundary conditions.
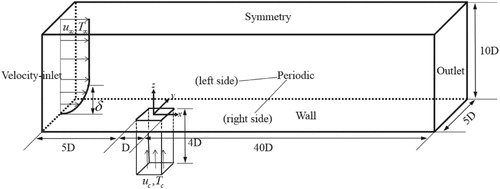
Figure 2. Grid independence test, mesh 1 (-), mesh 2 (·), mesh 3 (-).
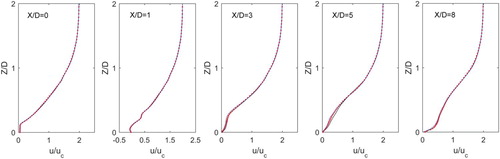
Figure 3. Comparison of the experimental measurements of Kohli and Bogard (Citation1997) with the film cooling effectiveness from the numerical simulations at (a) BR = 0.5, (b) BR = 1.5.
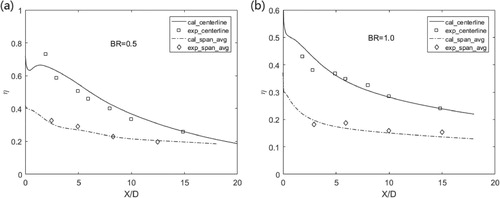
Figure 4. Comparison of the experimental measurements of Pietrzyk et al. (Citation1989) with velocity and turbulence profiles from the numerical simulations at BR = 0.5.
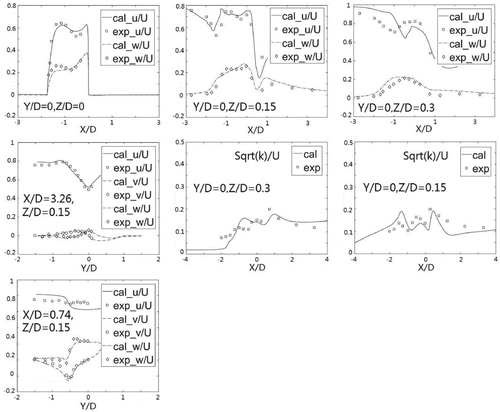
Figure 5. The correlation between Rortex and (a) Q criterion; (b) Lambda-2 criterion; (c) Swirling strength.
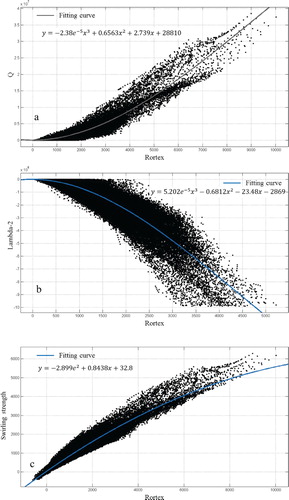
Table 1. Correspondence of the threshold of each method.
Figure 6. The vortex visualization by Rortex, Q criterion, Lambda-2 criterion and swirling strength at BR = 0.1.
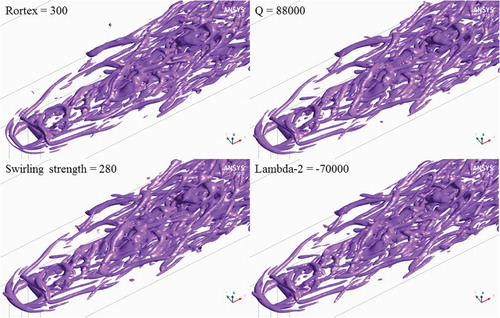
Figure 7. The vortex visualization by Rortex, Q criterion, Lambda-2 criterion and swirling strength at BR = 0.5.
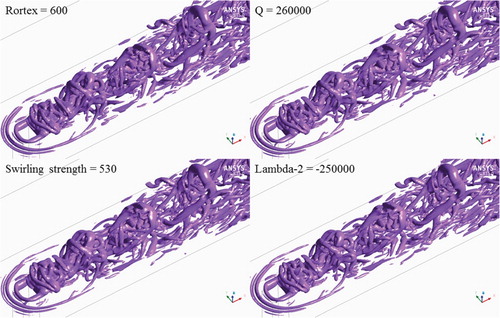
Figure 8. Vortex visualization by Rortex, Q criterion, Lambda-2 criterion and swirling strength with different values and 3D streamlines at BR = 0.5.
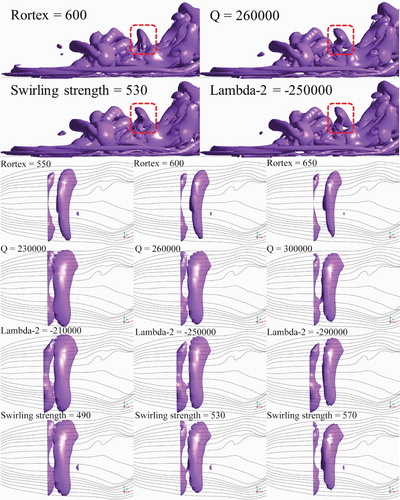
Figure 9. The vortex visualization by Rortex method and the monitoring points at BR = 0.1.
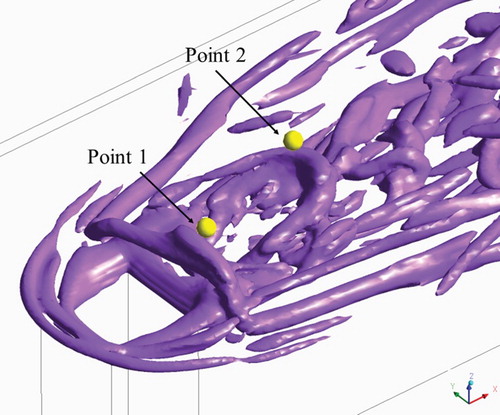
Figure 10. The shedding process of horseshoe vortex by Rortex method at BR = 0.1.
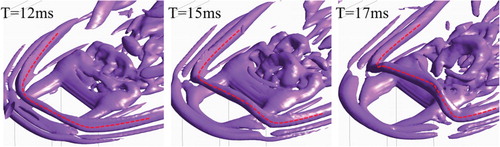
Figure 11. The horseshoe vortex by Rortex method of the periodic times at BR = 0.1.
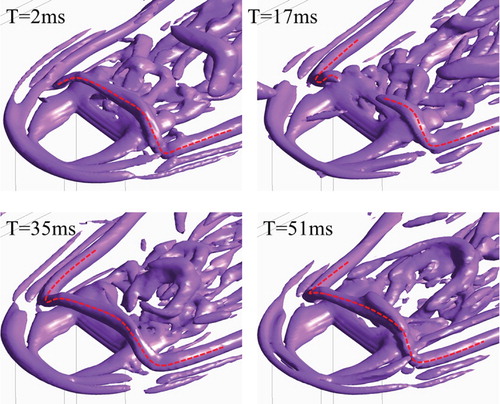
Figure 12. The shedding process of shear vortex by Rortex method at BR = 0.1.
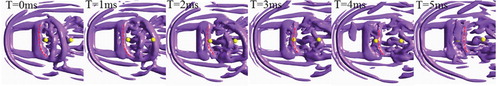
Figure 13. The shear vortex by Rortex method of the periodic times at BR = 0.1.
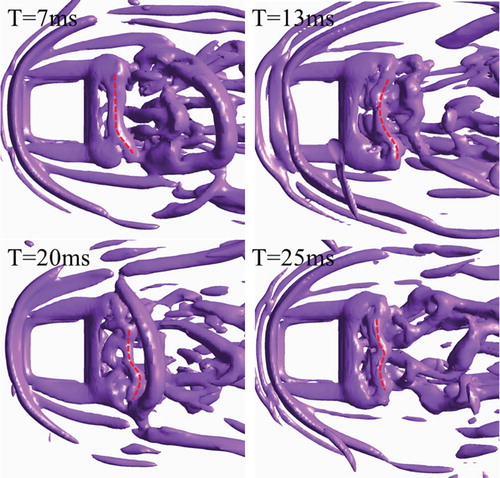
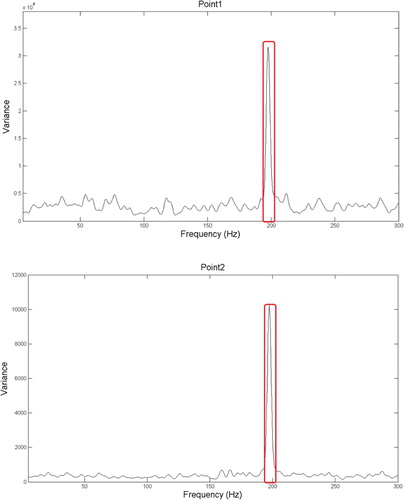
Figure 14. The power spectrum density of Rortex values at BR = 0.1.
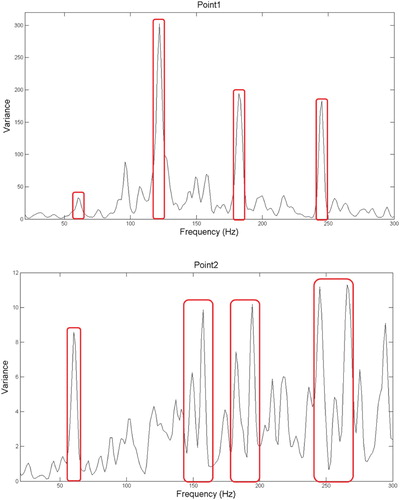
Figure 15. The vortex visualization by Rortex method and the monitoring points at BR = 0.5.
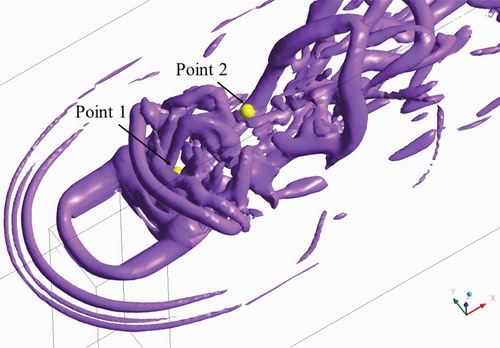
Figure 16. The shedding process of hovering vortex by Rortex method at BR = 0.5.
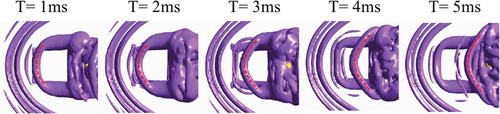
Figure 17. The hovering vortex by Rortex method of the periodic times at BR = 0.5.
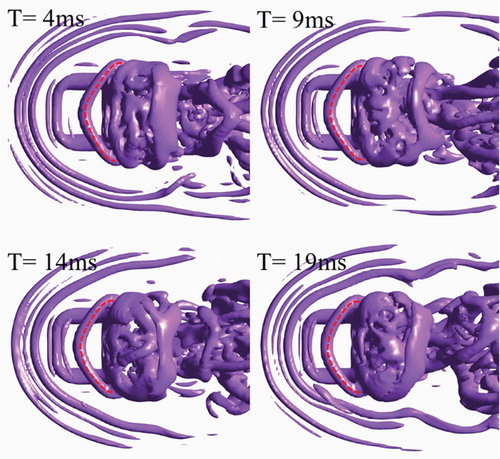
Figure 18. The power spectrum density of Rortex values at BR = 0.5.