Figures & data
Figure 1. Accumulation of particles in the riser.
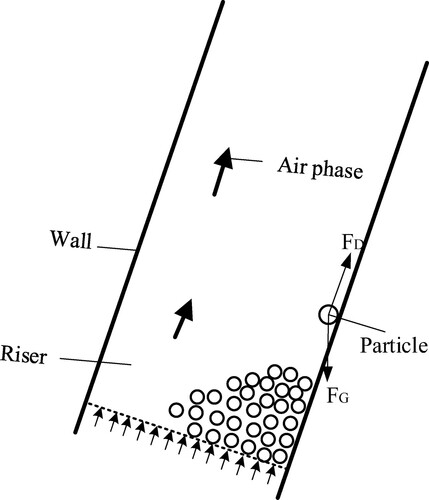
Figure 2. The dynamic control method of the air distribution plate.
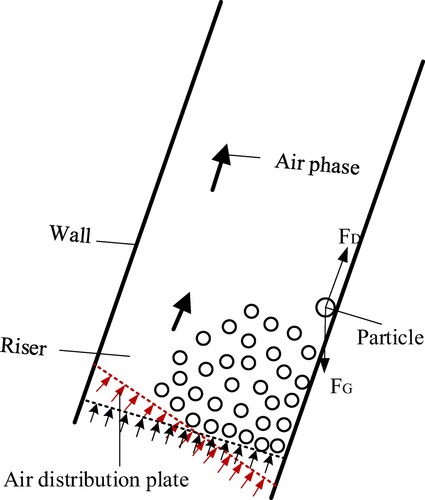
Figure 3. (a) Geometry model of the RCFB. (b) Rolling process of the RCFB.
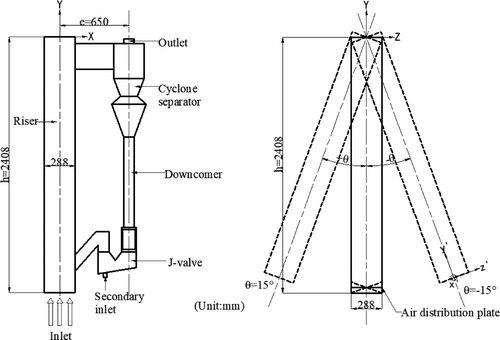
Table 1. Different Simulation calculation cases.
Table 2. Setting of simulation parameters.
Figure 4. The compared pressure gradient along with the riser height y′ in the RCFB between the simulation performed by Wang et al., Citation2020 and the experiment conducted by Zhao et al., Citation2016 (a) upright (θ = 0°), (b) θ = 15°
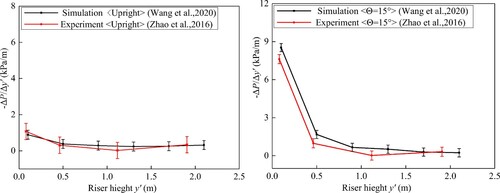
Figure 5. Particle distribution in the riser with different inclined angles of air distribution plate.
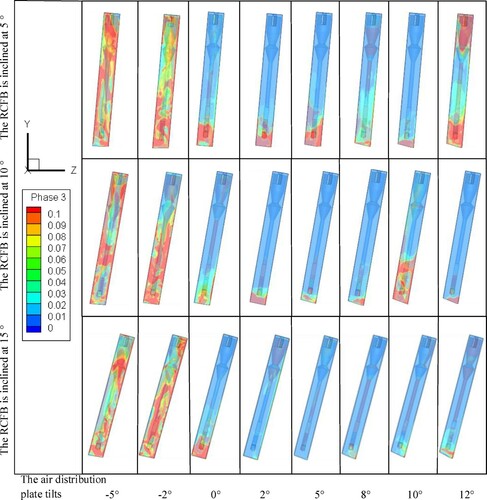
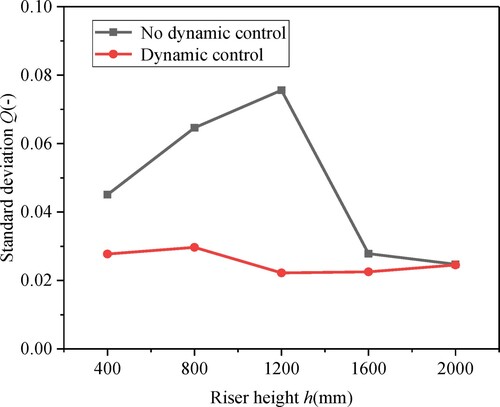
Figure 6. Standard deviation in the riser changed with different inclined angles of air distribution plate.
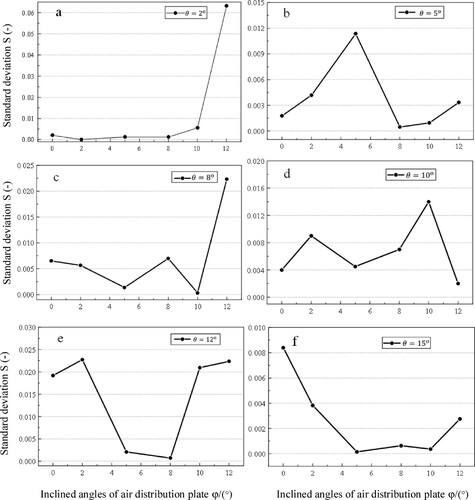
Figure 7. Function fitting diagram of air distribution plate inclination angle and riser inclination angle.
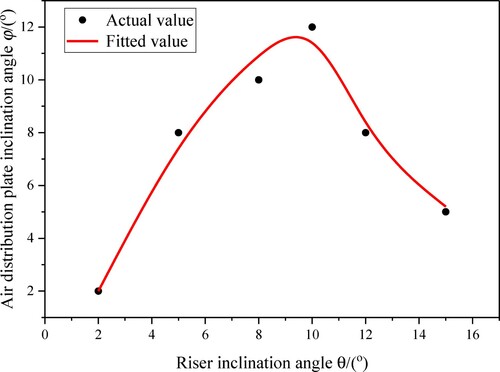
Figure 8. Function diagram of riser inclination angle and air distribution plate inclination angle.
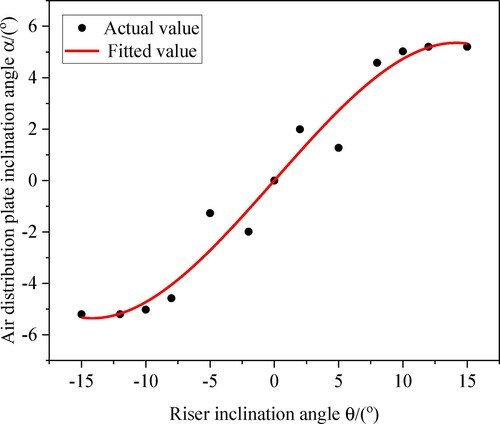
Figure 9. Cloud figure of particle distribution in the riser before and after dynamic control.
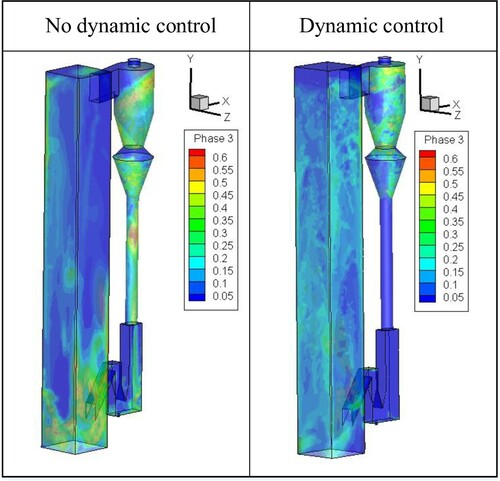
Figure 10. Particle distribution in the riser before and after dynamic control.