Figures & data
Figure 1. Double-unit train and double-unit region.
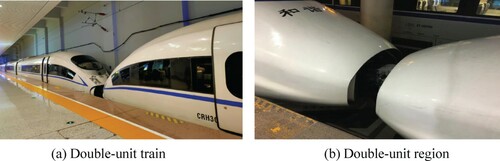
Figure 2. Geometry model.
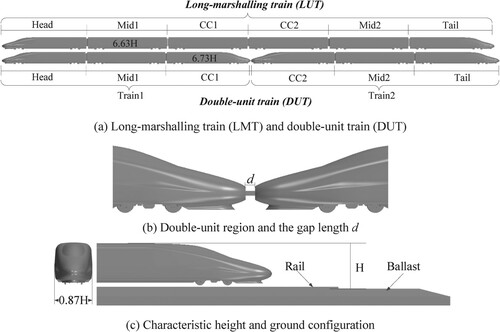
Figure 3. Computational domain.
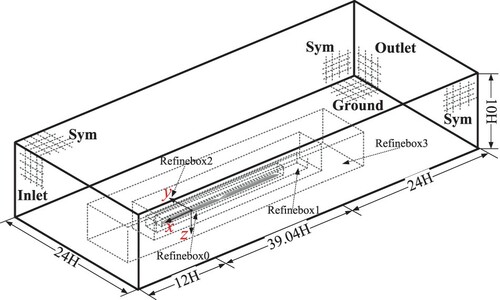
Figure 4 Models in the numerical simulations and wind tunnel experiments.
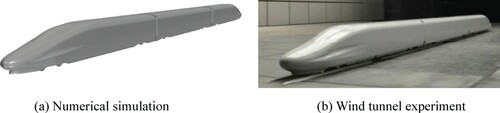
Figure 5 Results of numerical simulations and wind tunnel tests.
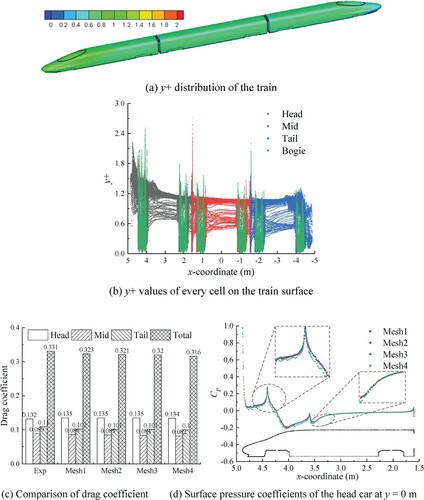
Table 1. Cell size in different regions (mm).
Figure 6 Computational mesh.
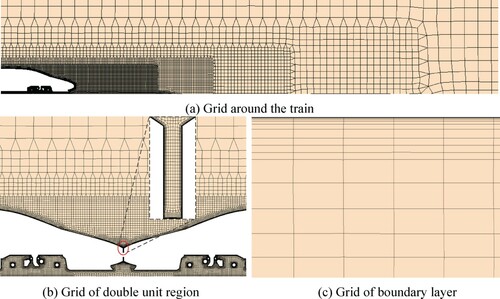
Figure 7 Pressure and velocity distribution of two types of trains at y = 0 m.
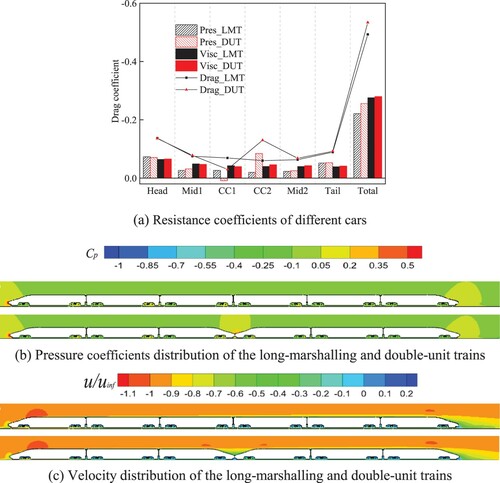
Figure 8 Surface pressure coefficients of the car at a cut plane y = 0 m.
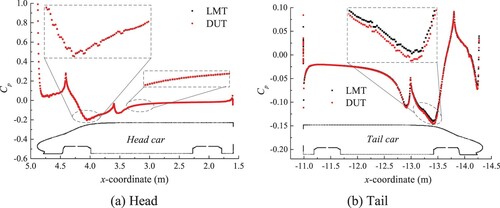
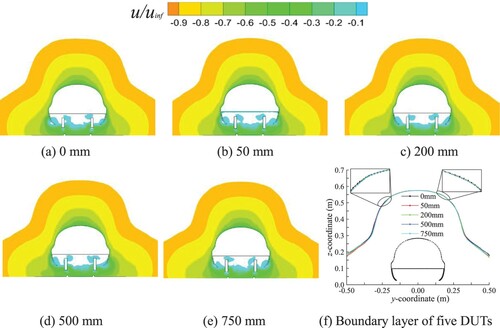
Figure 9 Boundary layer of different cross sections of two types of trains.
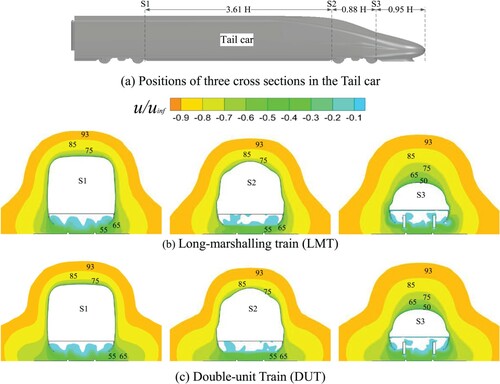
Figure 10 Velocity distribution of different cross sectionsof two types of trains.
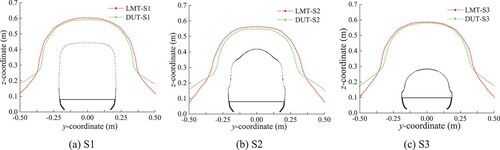
Figure 11. Resistance coefficients of cars.
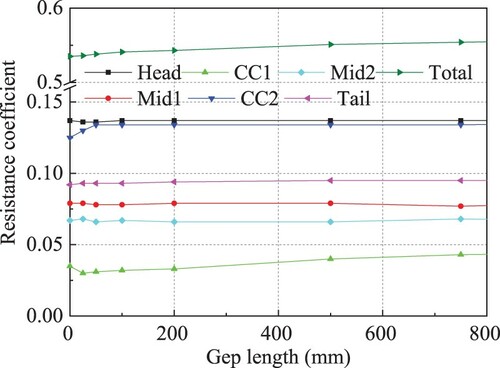
Figure 12 Resistance of the CC1 and CC2 cars.
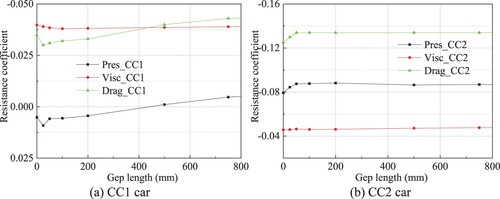
Figure 13 Surface pressure coefficients of the car at a cut plane y = 0m.
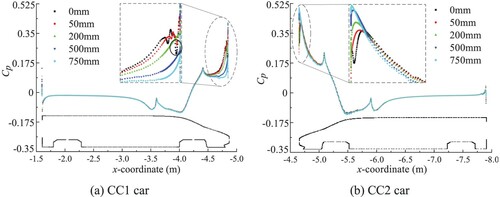
Figure 14. Pressure distribution around the double-unit region at the section of y = 0m.
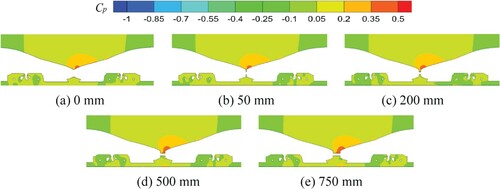
Figure 15. Surface pressure coefficients of the tail car at the section of y = 0 m.
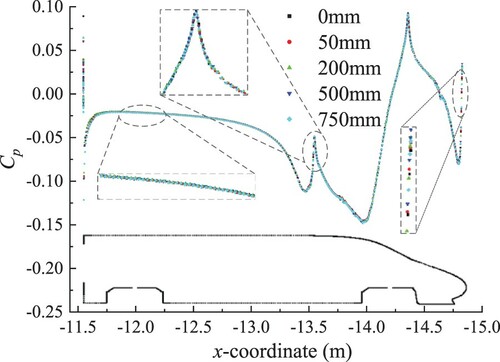
Figure 16. Boundary layer around the train at S3 cross sections for different DUTs.