
Figures & data
Figure 1. Wind-induced accident in Japan.
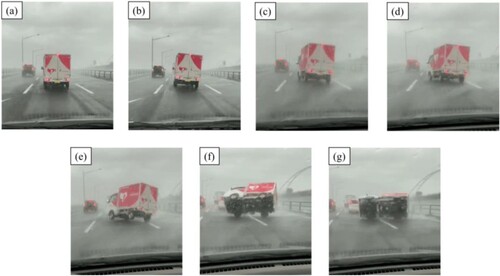
Figure 2. Cross-section of Yibin Lingang Yangtze River Bridge (Unit: mm) (Wang & Saul, Citation2020).
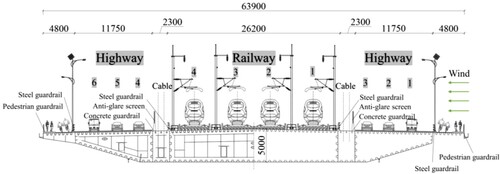
Figure 3. The configuration of the CRH3 model: (a) Scaled prototype from Schober et al. (Citation2010); (b) Numerical model in the present study.
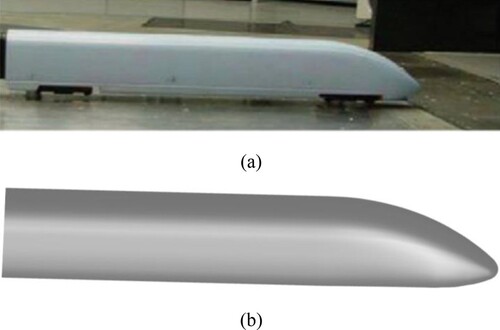
Figure 4. Configuration of the road vehicle: (a) Van; (b) Bus; (c) Truck trailer.
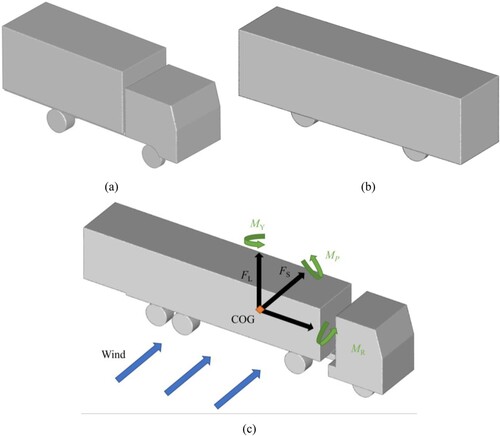
Table 1. Geometrical information about the road vehicles.
Figure 5. Calculation domain and boundary condition.
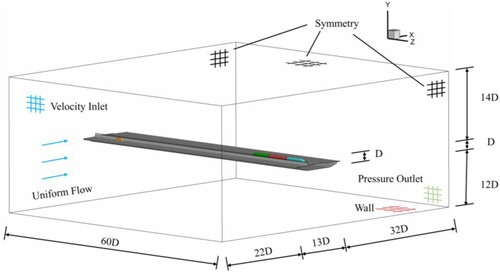
Figure 6. Structural and non-structural hexahedral gird area: (a) calculation domain; (b) bridge deck.
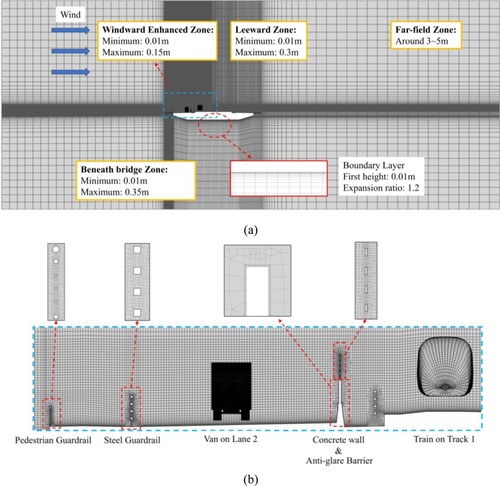
Figure 7. Mesh generation and boundary condition of road vehicle zone (Van).
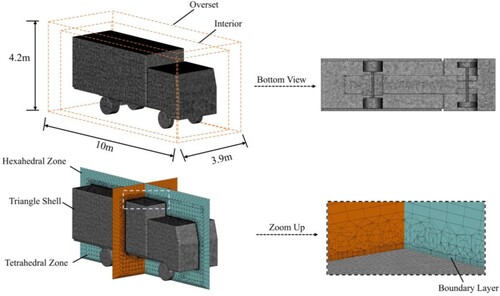
Figure 8. Mesh generation and boundary condition of train zone.
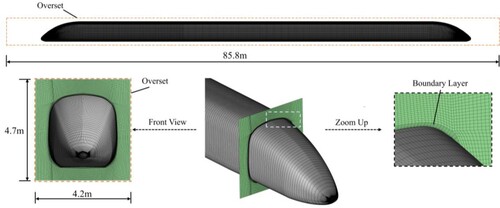
Figure 9. Flow chart of overset mesh: (a) Assembly; (b) Interpolation.
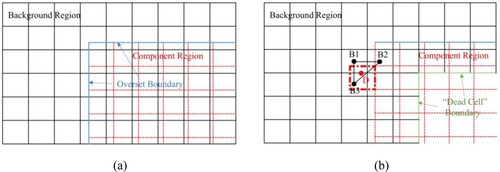
Table 2. Grid information in the grid independence verification (Unit: million).
Figure 10. Fs of the van on lane 3 in different mesh resolution.
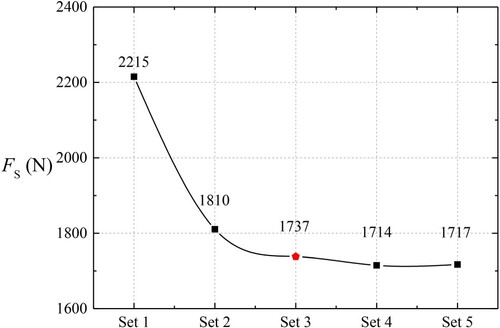
Figure 11. Velocity contour of the steady computation.
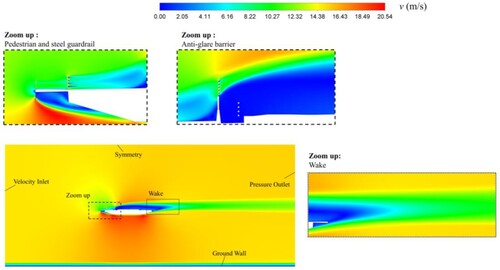
Figure 12. Large-scale sectional model wind tunnel test.
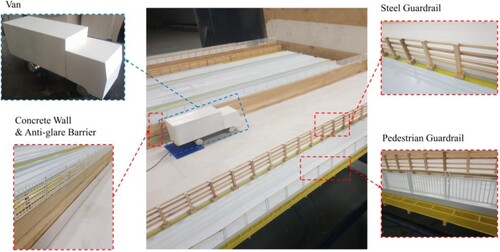
Table 3. Comparison between the wind tunnel test and simulation.
Figure 13. Moving model system and test condition: (a) Vertical view; (b) Side view.
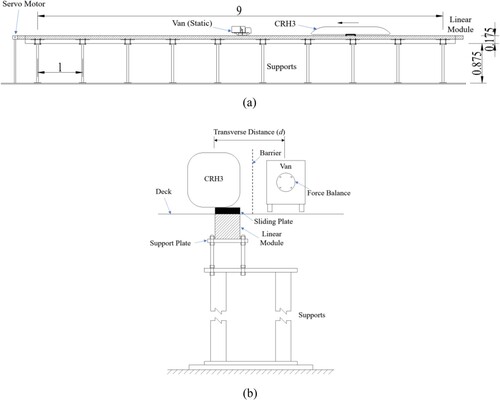
Figure 14. Vehicle models in the moving model tests: (a) Van; (b) Bus; (c) CRH3 (up) and cuboid train (down).
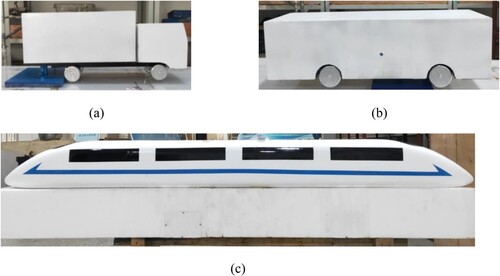
Figure 15. Comparison of the variation curve of CS.
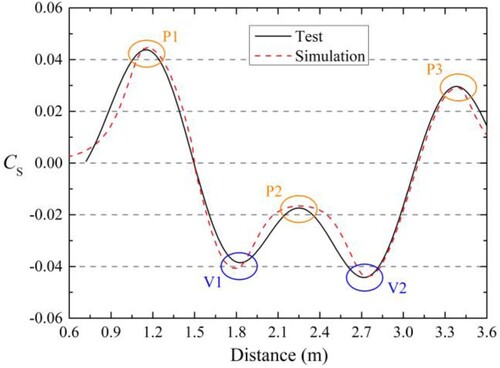
Table 4. Quantitative comparisons among the peak/valleyvalues.
Figure 16. Comparison of peak/valley values and attenuation ratio: (a) P1; (b) V1.
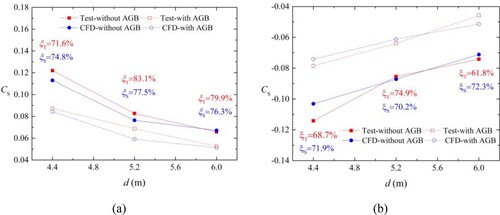
Figure 17. Pressure distribution of sole-traveling vehicle: (a1) ∼ (a2) Pressure iso-value surface of 100 Pa; (b1) ∼ (b2) Pressure distribution on the vehicle-bridge system; (c1) ∼ (c2) Horizontal plane 1.5 m above the deck. (Unit: Pa).
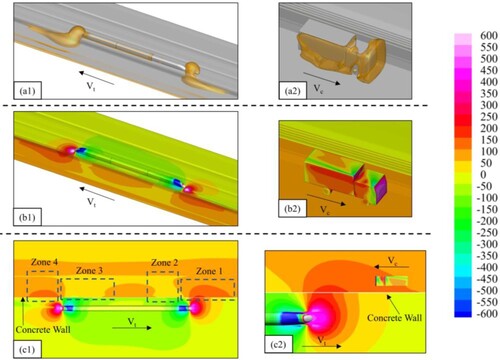
Figure 18. Definition of the relative location.
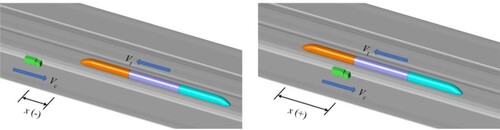
Figure 19. Pressure distribution on the vehicle-bridge system (Unit: Pa).
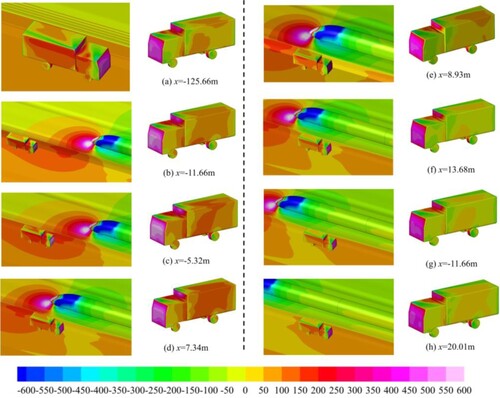
Figure 20. Aerodynamic coefficients of van on different lanes: (a) CS; (b) CL; (c) CMR; (d) CMY; (e) CMP.
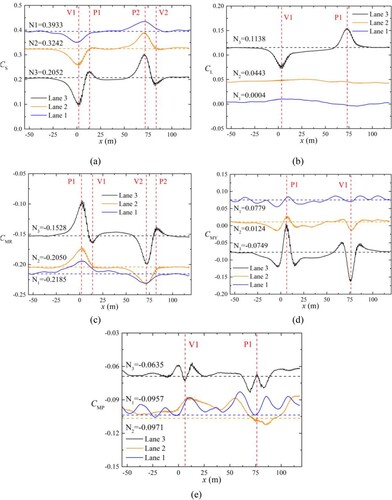
Table 5. Case details on different road lanes.
Table 6. Quantitative information for the aerodynamic forces of the van on different lanes.
Table 7. Case details for the influence on different road vehicles.
Figure 21. Aerodynamic forces of different road vehicle: (a) CS; (b) CL; (c) CMR; (d) CMY; (e) CMP.
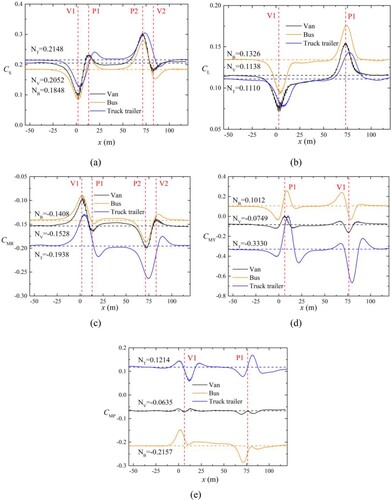
Table 8. Quantitative information of different vehicles (Unit: Force-N, Moment N·m).
Table 9. Case details of the superposition of crosswind and train-induced wind.
Table 10. Aerodynamic coefficients under different wind yaw angles.
Figure 22. Aerodynamic variation of the van at different wind speeds.
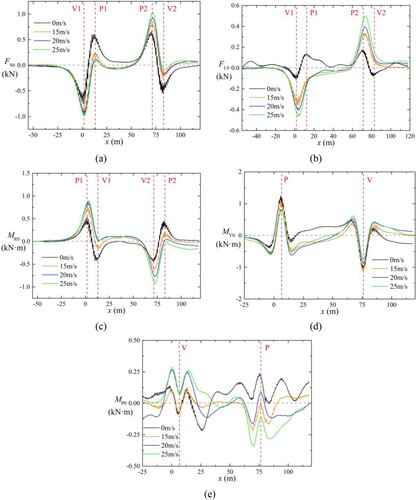
Table 11. Peak/valley values and variation amplitudes at different wind speeds (Unit: kN, kN·m).