Figures & data
Figure 1. Schematic of the experimental system.
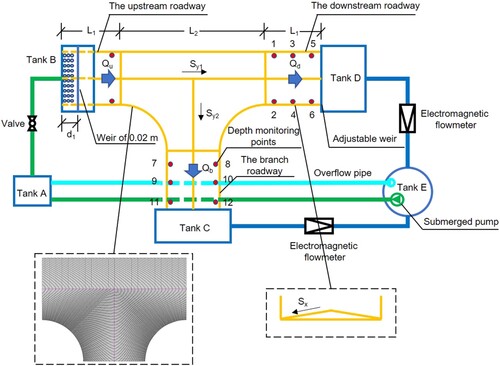
Figure 2. Site photo of the experimental setups.
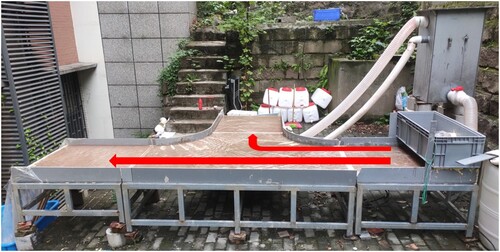
Figure 3. Boundary conditions of CFD model.
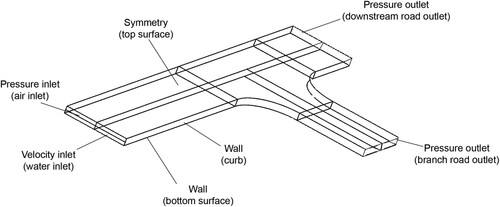
Figure 4. Computational mesh in the horizontal and vertical directions.
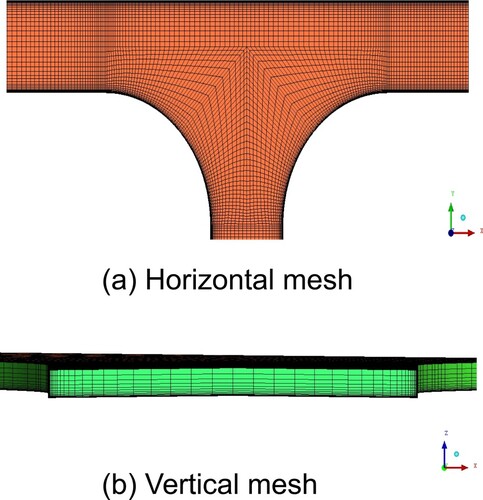
Table 1. Factors and levels selected for the 2k factorial design experiments.
Table 2. Setups of the 2k factorial design experiments.
Table 3. Parameter combinations used in the CFD model validation tests.
Figure 5. Comparison of experimental results and numerical predictions: (a) flow distribution ratio; (b) water depth, where A1 is 1% longitude slope, A2 is3% longitude slope, and A3 is 5% longitude slope for all roadways.
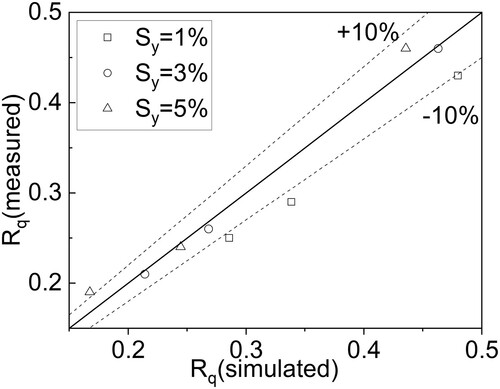
Figure 6. Comparison of water depth measured experimentally and predicted numerically along the channel.
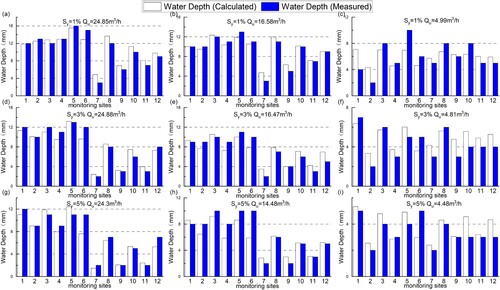
Figure 7. Pareto chart results of 2k factorial design experiments, where the dash line represents the threshold that a variable is considered to be important to the flowrate distribution ratio.
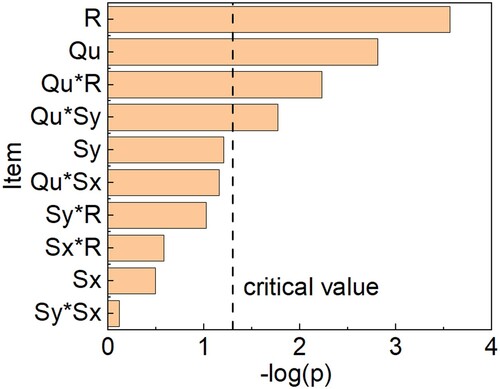
Table 4. Factors and levels used in the multi-level full sequence simulations.
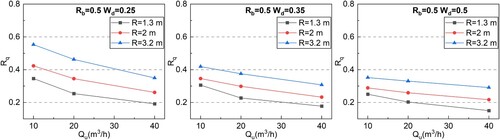
Figure 8. Relationship of distribution ratio Rq versus inflow flowrate Qu at different turning radius R when longitude slope Sy is fixed.
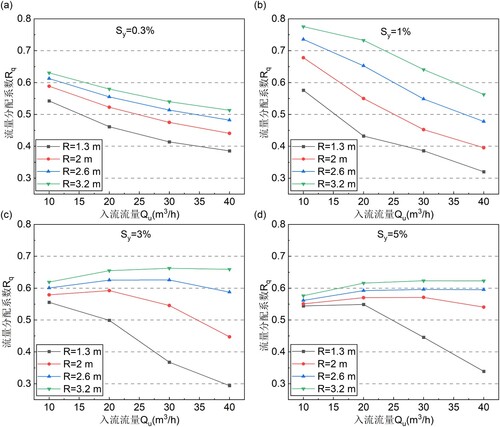
Figure 9. Numerically simulated streamlines at the road crossing under different combinations of turning radius R and longitudeslope Sy.
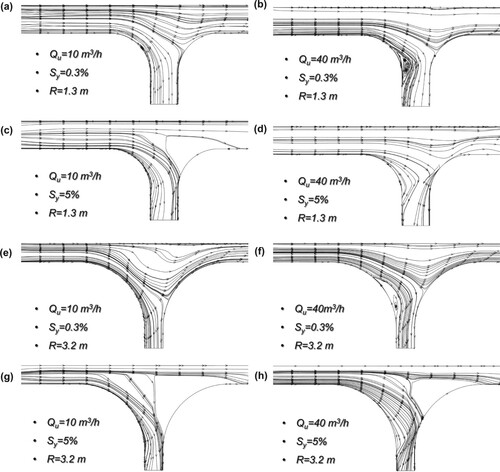
Figure 10. Comparison of Flowrate distribution ratio from this study and Ghostine’s study on flat-bottom diversion channels (Ghostine et al., Citation2013).
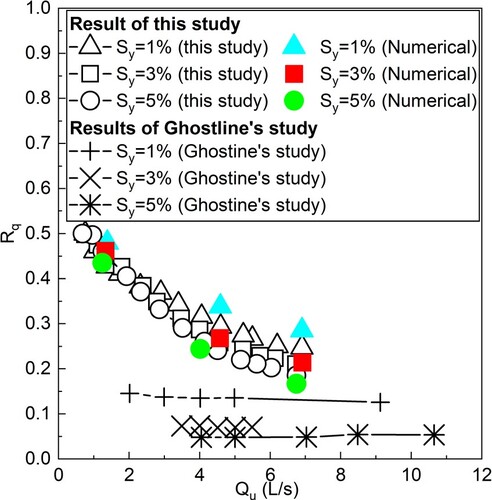
Figure 11. Comparison of streamlines at Su = Sb = Sd = 1%, (a), (c), (e) are road crossings with side slope and a turning radius of 0.6 m; (b), (d), (f) is the flat bottom diversion channels.
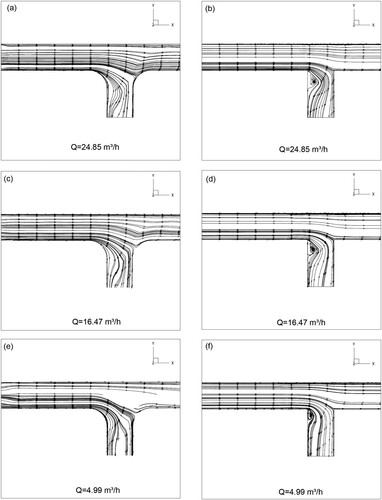
Figure 12. Relationship of distribution ratio Rq versus inflow flowrate Qu at different longitude slope Sy when turning radius R is fixed.
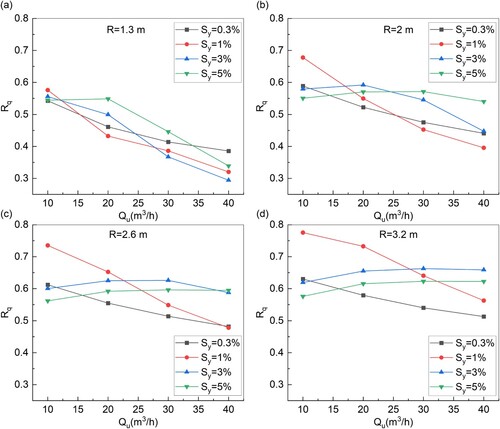
Figure 13. Relationship of distribution ratio Rq versus inflow flowrate Qu at different downstream standing water depth in the main road.
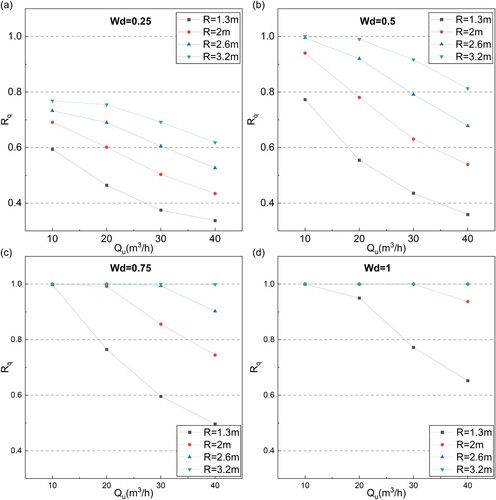
Figure 14. Relationship of distribution ratio Rq versus inflow flowrate Qu at different downstream standing water depth in the main road and branch road.