
Figures & data
Figure 1. Pump model.
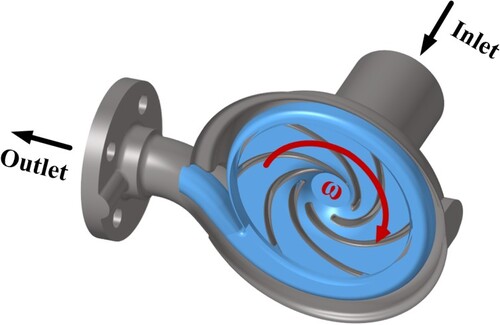
Table 1. Geometry and performance parameters.
Figure 2. Mesh of fluid domain: (a) Boundary layers; (b) Impeller.
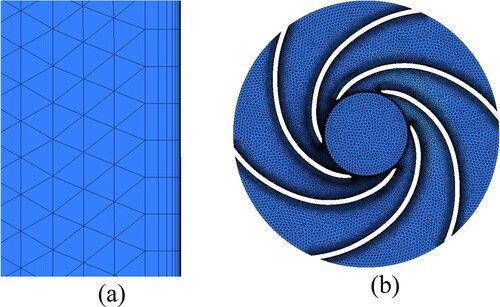
Figure 3. Independence analysis: (a) Grid number; (b) Time-step.
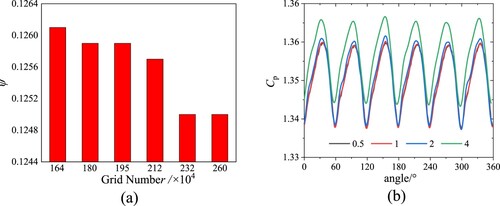
Figure 4. y plus contour.
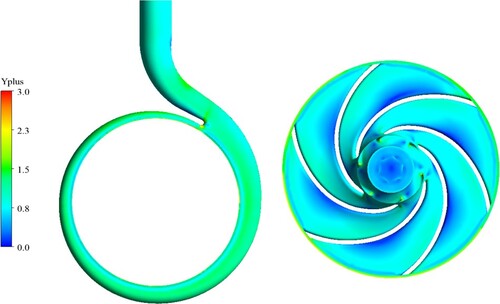
Figure 5. Layout of the closed test system. 1-water reservoir, 2-flowmeter, 3-piezoresistive pressure sensors, 4-pump, 5-piezoelectric presser sensor, 6-valve.
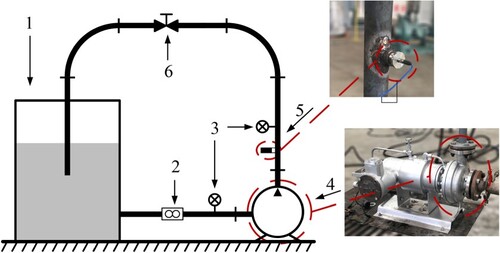
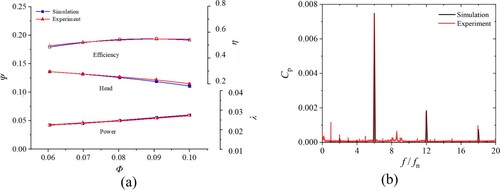
Figure 6. Comparison of experimental and simulated results: (a) pump performance; (b) pressure fluctuation.
Table
Figure 7. Flowchart of quasi–bivariate VMD.
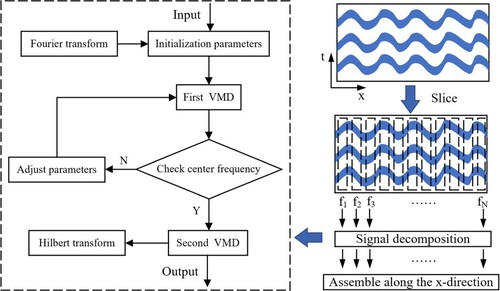
Figure 8. Effect of fluctuating rotation speed on radial force: (a) orbit diagram; (b) frequency spectra.
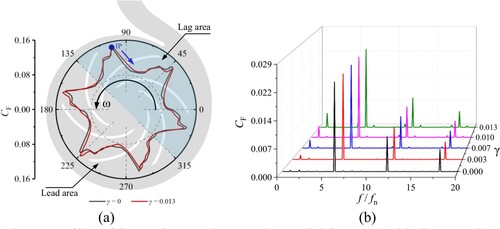
Figure 9. Effect of fluctuating rotation speed on pressure pulsation: (a) time domain; (b) frequency domain.
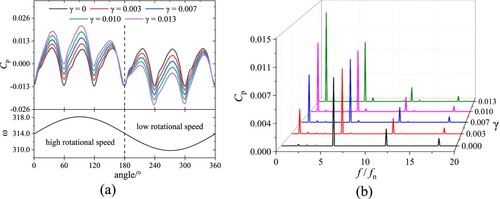
Figure 10. Effect of fluctuating rotation speed on pressure pulsation and radial force intensity.
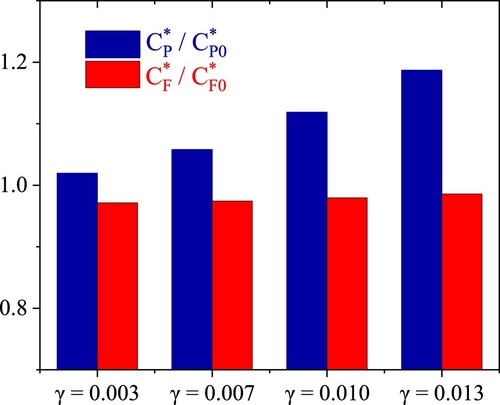
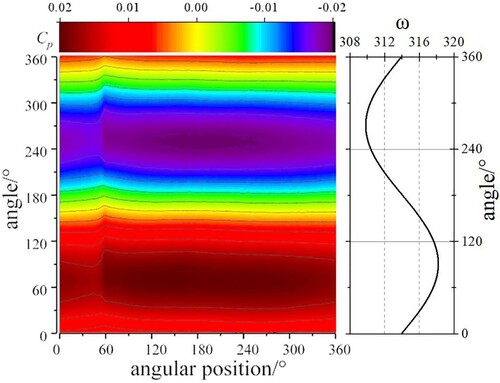
Figure 11. Time history of the pressure pulsation around the impeller outlet: (a) stationary rotation speed; (b) fluctuating rotation speed.
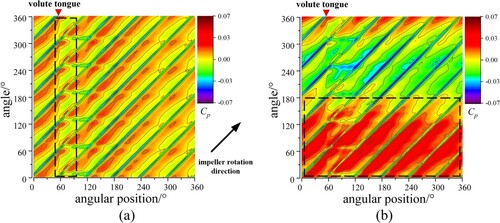
Figure 12. Time history of the velocity pulsation around the impeller outlet: (a) stationary rotation speed; (b) fluctuating rotation speed.
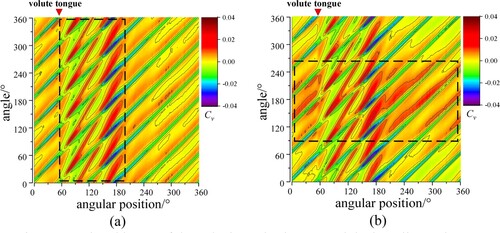
Figure 13. Absolute velocity contour on pump mid-plane.
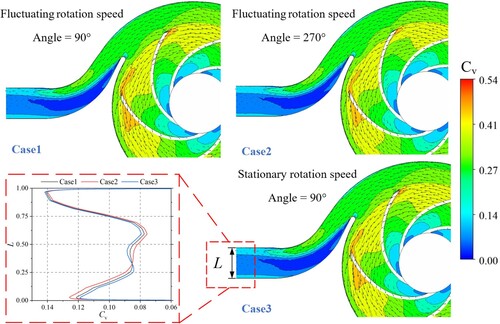
Figure 14. Vortex structure comparisons in different moments.
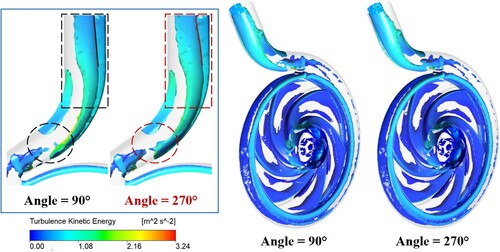
Figure 15. Decomposition results of pressure pulsation using VMD: (a) stationary rotation speed; (b) fluctuating rotation speed.
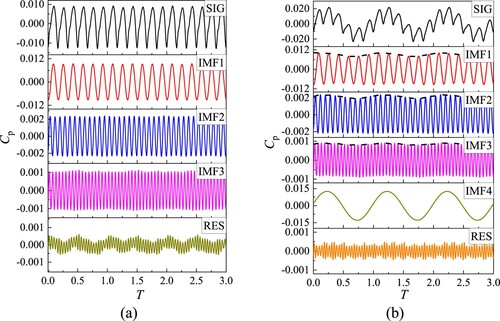
Figure 16. Decomposition results of pressure pulsation in the frequency domain: (a) stationary rotation speed; (b) fluctuating rotation speed.
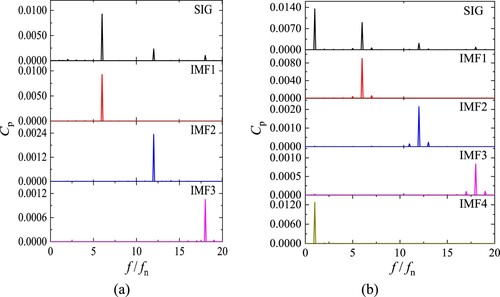
Figure 17. Hilbert spectrum at fluctuating rotation speed.
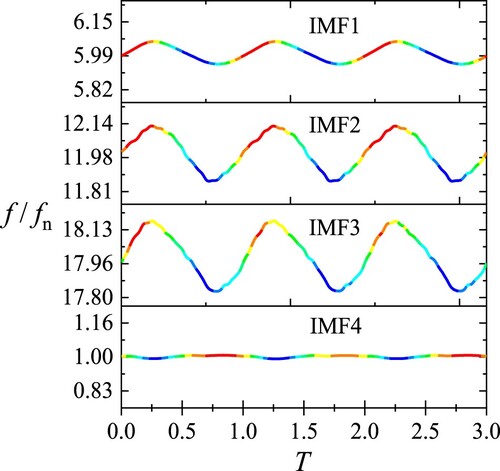
Figure 18. Effect of fluctuating rotation speed on instantaneous amplitude and frequency.
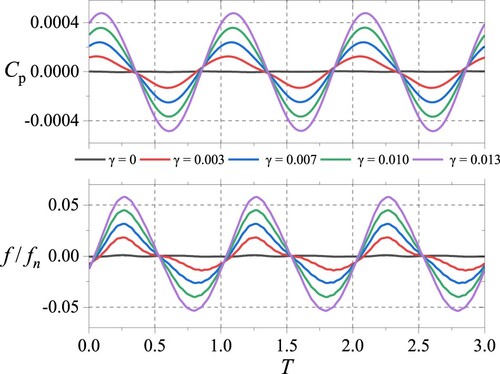
Figure 19. Marginal spectrum at fluctuating rotation speeds.
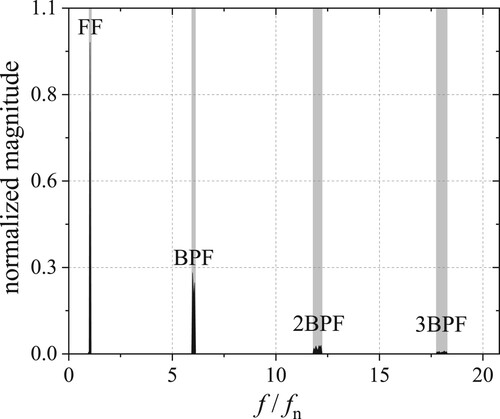
Figure 20. Time history of pressure pulsation under BPF: (a) stationary rotation speed; (b) fluctuating rotation speed.

Figure 21. Time history of pressure pulsation under FF.
Table
Data availability statement
The data that support the findings of this study are available from the corresponding author upon reasonable request.