Figures & data
Figure 1. Winter chimney effect in high-rise buildings: (a) chimney effect sketch map; (b) schematic diagram of chimney expansion fire.
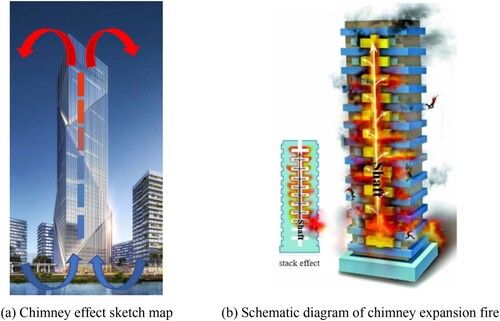
Figure 2. Schematic diagram of the computational model.
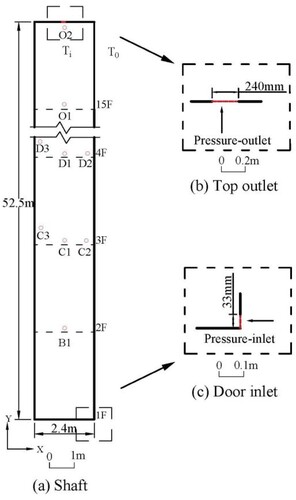
Table 1. Monitoring point information.
Table 2. Working condition list.
Figure 3. Schematic diagram of shaft model mesh: (i) is the mesh near the top outlet, and (ii) is the mesh near the bottom entrance. (a) whole grid; (b) 1st local grid; (c) grid near boundary.
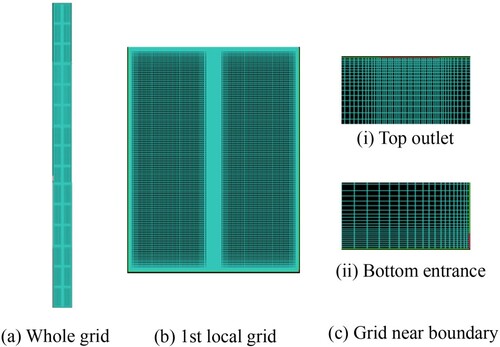
Table 3. Grid independence verification.
Table 4. Time step independence verification.
Figure 4. Comparison of CFD simulation, theoretical prediction and experimental data (Ahn et al., Citation2019).
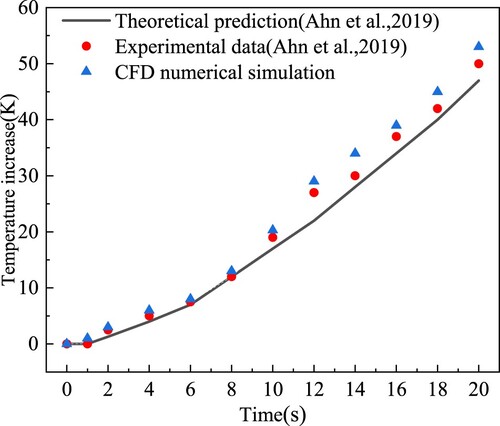
Figure 5. Dimensionless temperature rise curves of monitoring points B1, F1, J1, and O2 over time for low-floor fire cases: (a) B1; (b) F1; (c) J1; (d) O2.
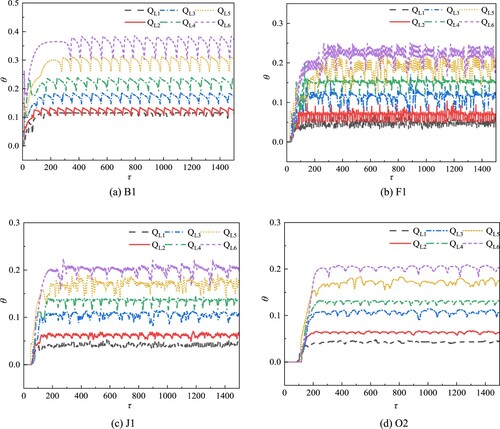
Figure 6. Dimensionless temperature rise spectrum analysis of monitoring points B1, F1, J1, and O2 for low-floor fire cases: (a) B1; (b) F1; (c) J1; (d) O2.
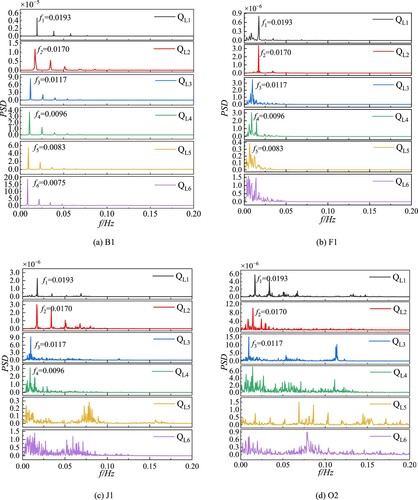
Figure 7. Time series of temperature rise at monitoring point B1 in the fully developed phase for case QL3.
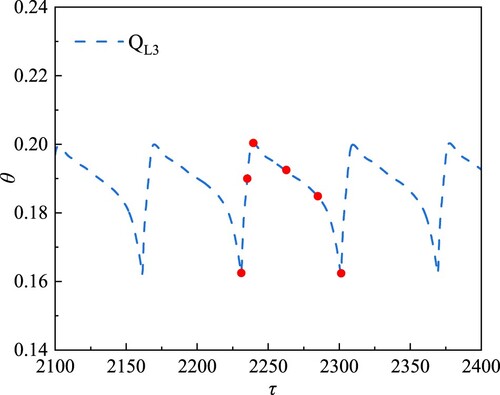
Figure 8. Temperature rise contour and streamline near the point B1 for case QL3.
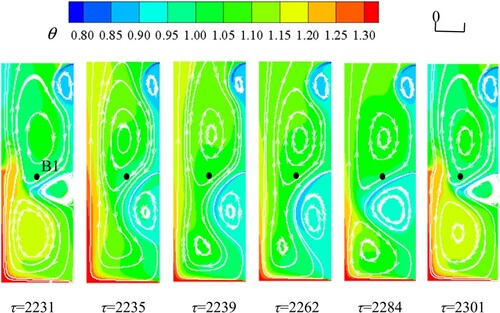
Figure 9. Temperature rise at different heights in the shaft.
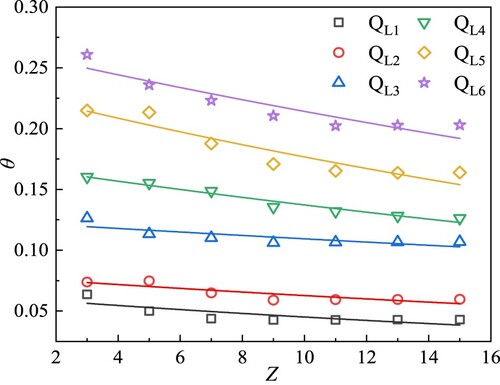
Table 5. Fitting parameters and correlation coefficients.
Figure 10. Relationship between smoke rise time and rise height for low-floor fire cases.
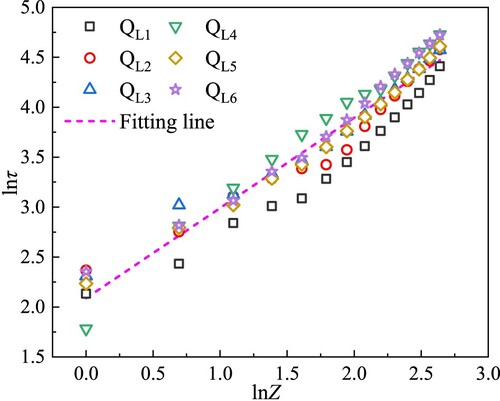
Figure 11. Relationship between smoke rise time and rise height for middle-floor fire cases.
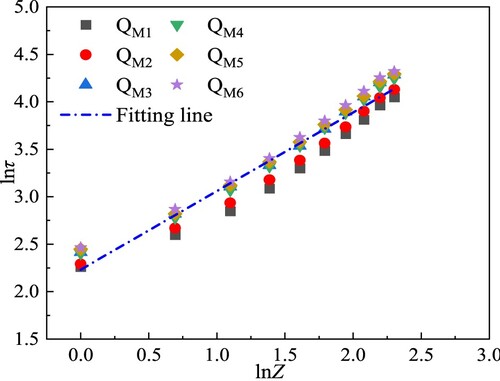
Figure 12. Relationship between fire smoke rise time and rise height with or without the chimney effect.
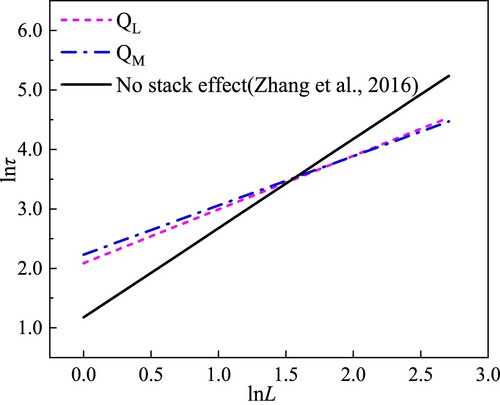
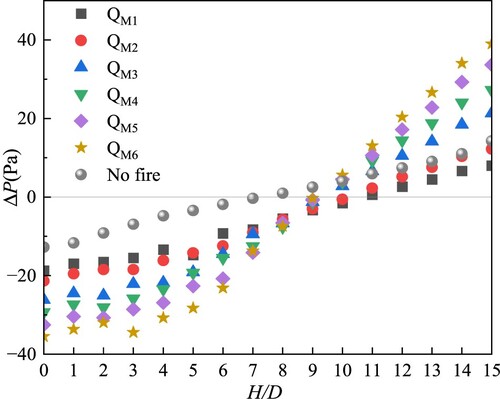
Figure 13. Distribution of differential pressure in the shaft at the fully developed stage for low-floor fire cases.
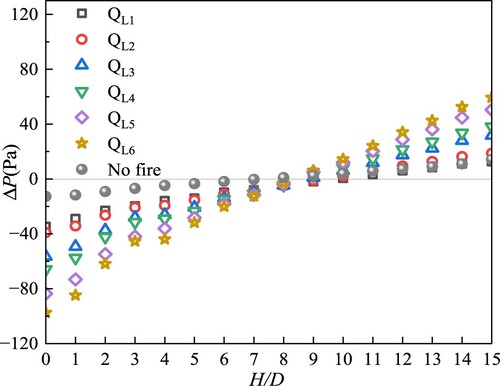
Figure 14. Distribution of differential pressure in the shaft at the fully developed stage for middle-floor fire cases.