
Figures & data
Figure 1. The representation of the proposed unit, (a) three-dimension of the domain, (b) axisymmetric two-dimension as the simulated model.
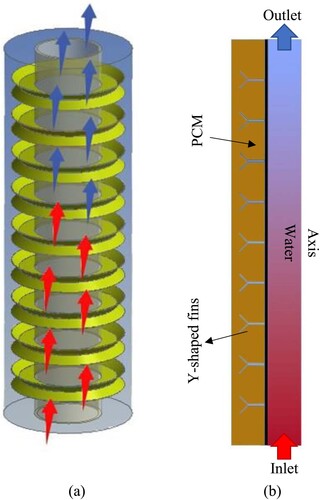
Figure 2. The schematic of a Y-shaped fin inside the outer tube shows the variable dimensions.
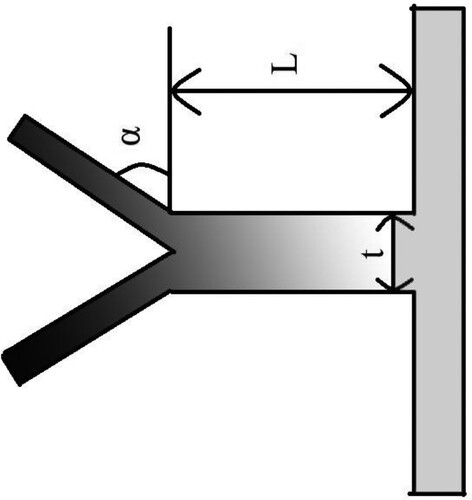
Table 1. Fins sizes of the examined cases involving the number, length, thickness, and angle of the Y-fins head.
Figure 3. A schematic of system operation for building applications
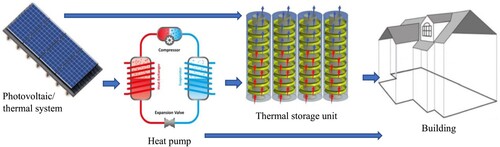
Table 2. Thermophysical characteristics of the PCM applied in this work, GmbH (Najim et al., Citation2022; Rubitherm, Citation2022).
Table 3. Impact of mesh and time step sizes on the melting period.
Figure 4. The shematic of the mesh generated after the mesh independence analysis
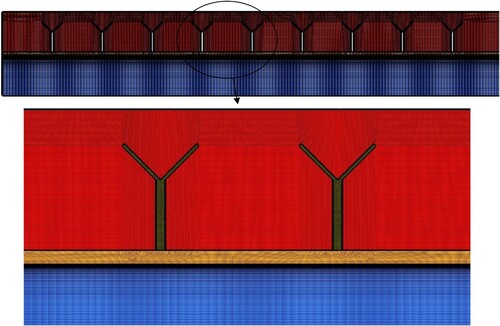
Figure 5. Melting time of the present work and the work of Longeon et al. (Citation2013).
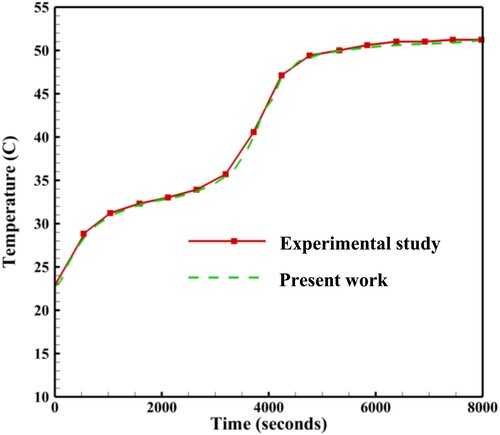
Figure 6. The PCM liquid and solid fractions for cases 0 and 2 (Straight and Y-shaped fins) at different times.
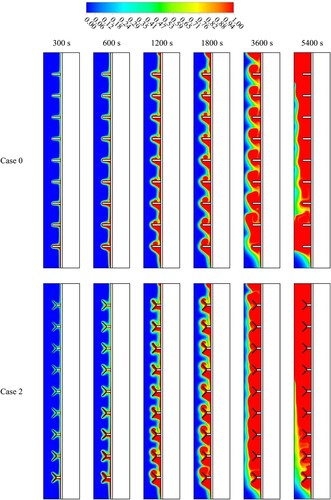
Figure 7. The PCM temperature profiles for the cases 0 and 2 (Straight and Y-shaped fins) at different time.
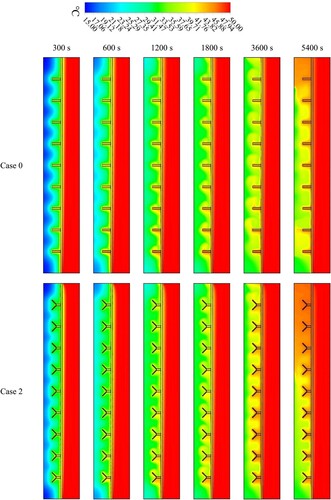
Figure 8. The PCM velocity contours for cases 0 and 2 (Straight and Y-shaped fins) at 3600 S.
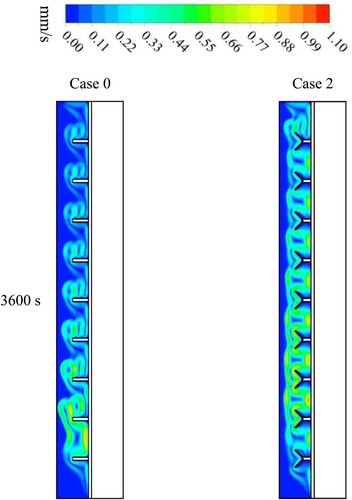
Figure 9. Development of the liquid fraction of the PCM for cases 0 and 2 (Straight and Y-shaped fins).
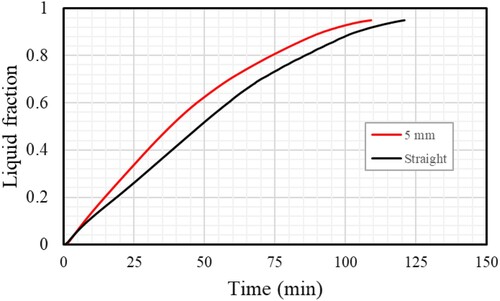
Figure 10. Development of the PCM temperature profile for cases 0 and 2 (Straight and Y-shaped fins).
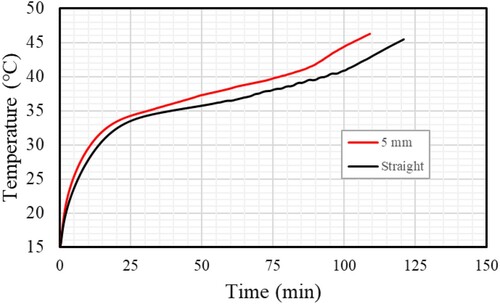
Figure 11. The melting period and the thermal storage rate of the PCM for cases 0 and 2 (Straight and Y-shaped fins).
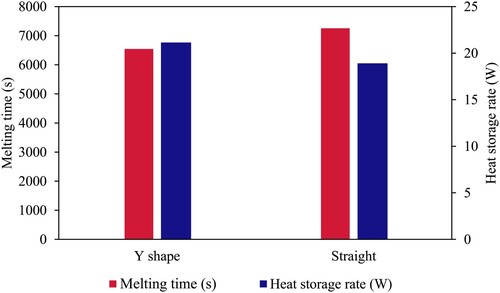
Figure 12. The liquid and solid fractions of the PCM for the system with Y-shaped fins with various lengths at different time steps.
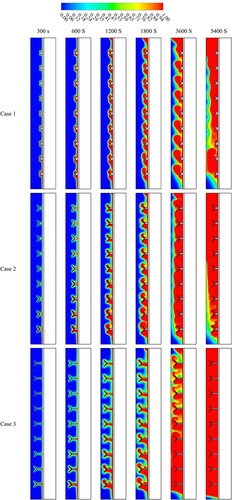
Figure 13. The temperature distributions of the PCM for the system with Y-shaped fins with various lengths at various time steps.
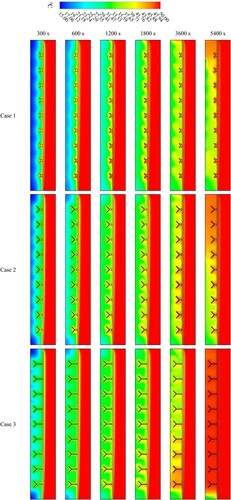
Figure 14. The PCM velocity profile for cases 1, 2 and 3 at the time of 3600 s.
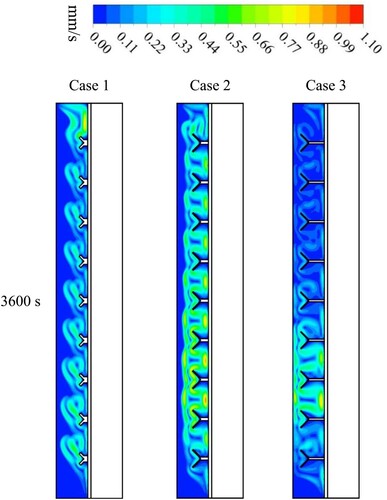
Figure 15. Development of the PCM liquid fraction for cases 1, 2 and 3.
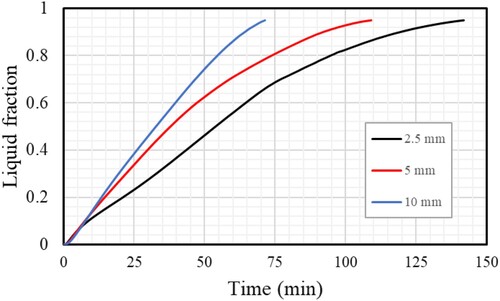
Figure 16. Development of the PCM temperature profile for cases 1, 2 and 3.
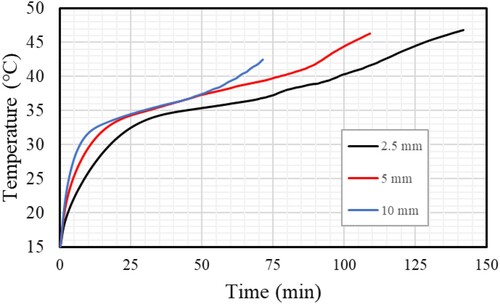
Figure 17. Melting time and the thermal storage rate for cases 1, 2 and 3.
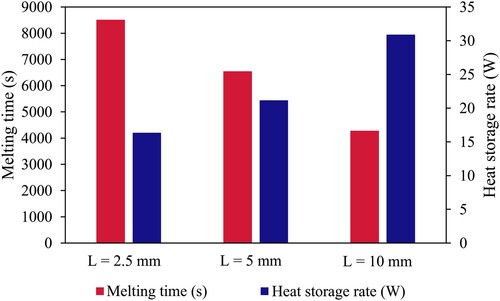
Figure 18. The PCM liquid and solid fractions for cases 3, 4 and 5 at various times.
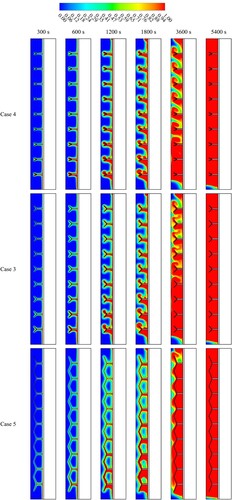
Figure 19. The PCM temperature distributions for cases 3, 4 and 5 using various angles of the fin’s tributaries at various times.
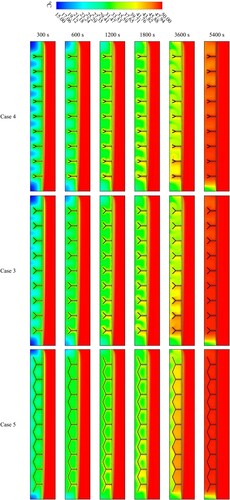
Figure 20. The PCM velocity counter for case 3, 4 and 5 with various angles of the fin’s tributaries at the 3600 s.
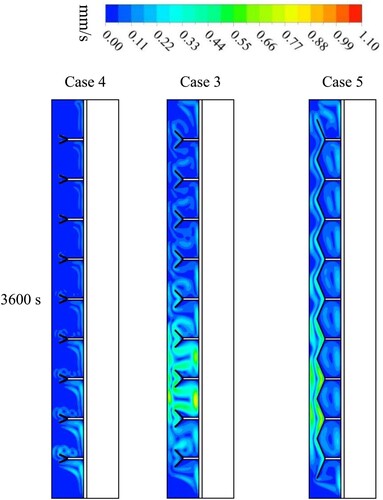
Figure 21. Liquid fraction of the PCM for various angles of the fin’s tributaries at different time
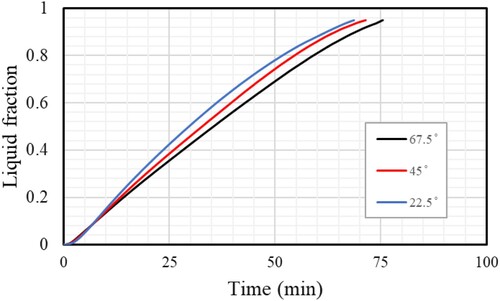
Figure 22. Mean PCM temperature for case 3, 4 and 5 as a function of time
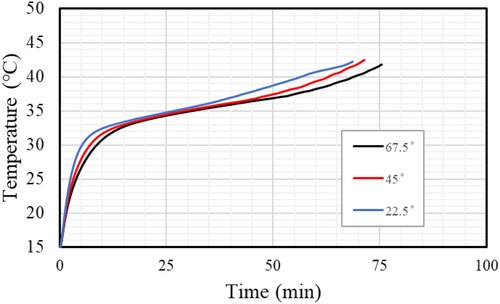
Figure 23. Melting time and heat storage rate of the PCM for various angles of the fin’s tributaries at different time
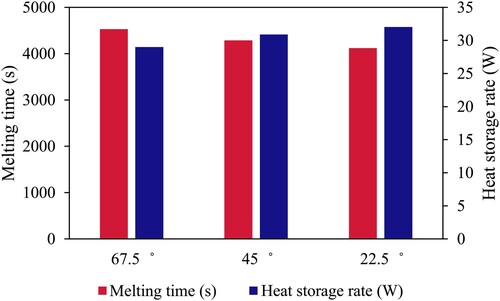
Figure 24. The liquid and solid fraction development for cases 5, 6 and 7.
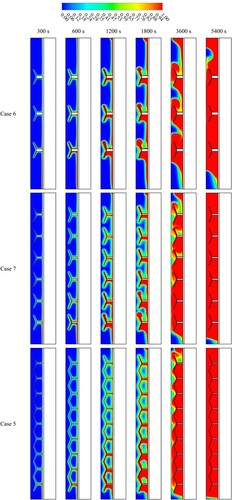
Figure 25. The PCM temperature profile development for cases 5, 6 and 7.
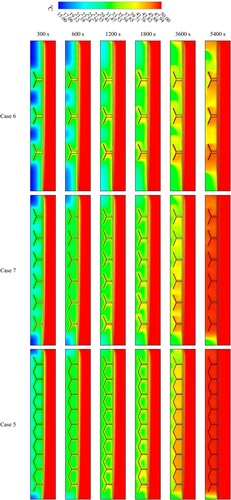
Figure 26. The PCM velocity for case 5, 6 and 7 at the time of 3600 s.
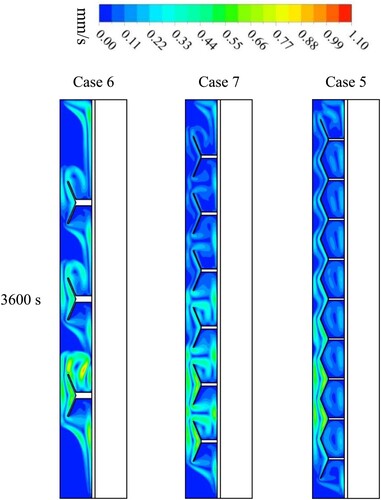
Figure 27. Development of the PCM liquid fraction for case 5, 6 and 7.
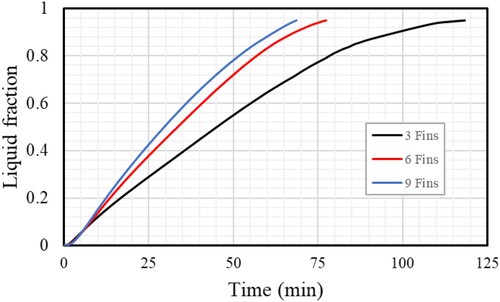
Figure 28. Average temperature of the PCM for case 5, 6 and 7.
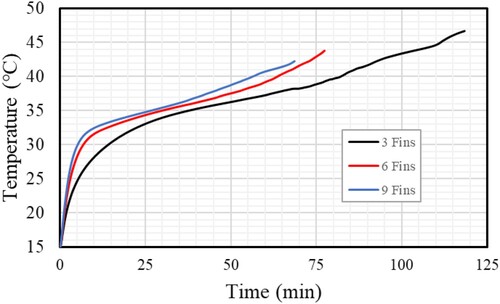
Figure 29. The melting time and heat storage rate of the PCM for the various numbers of fins.
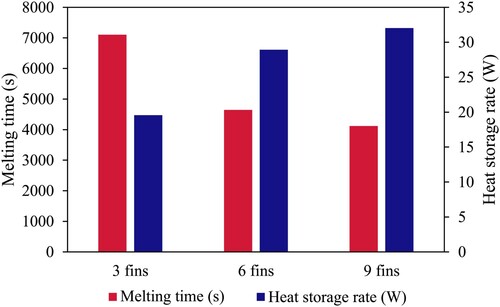
Figure 30. The liquid fraction generation of the PCM for different values of Re.
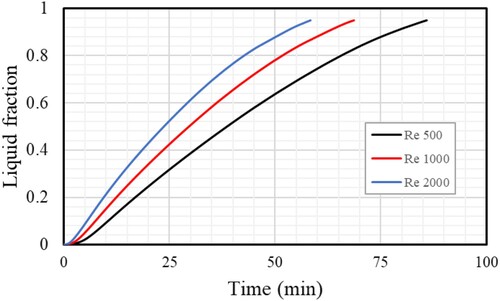
Figure 31. Mean PCM temperature for different values of Re.
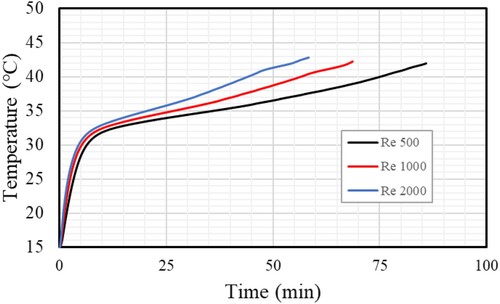
Table 4. PCM's melting time and heat storage rate for various values of Re.
Figure 32. Liquid fraction of PCM with three different HTFs’ inlet temperatures (45, 50, and 55°C).
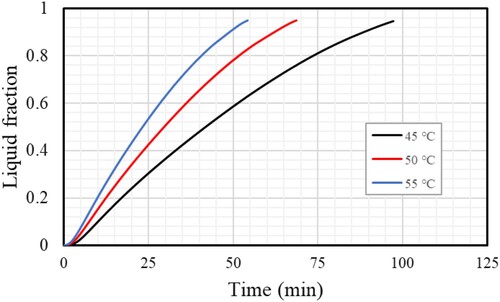
Figure 33. Mean temperature of PCM with three different HTFs’ inlet temperatures (45, 50, and 55°C).
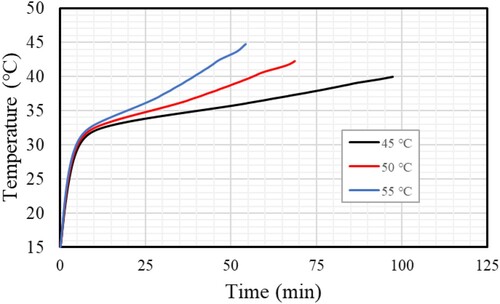
Table 5. PCM's melting time and the heat storage rate during the charging procedure for various values of inlet temperatures.