Figures & data
Figure 1. Schematic of 1D MOC.
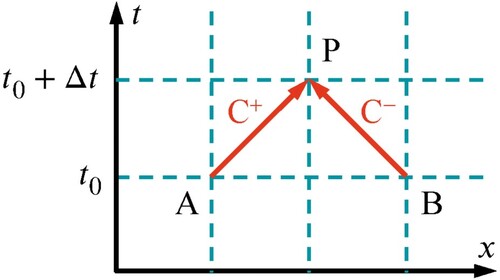
Figure 2. Schematic of 1D-3D coupling.
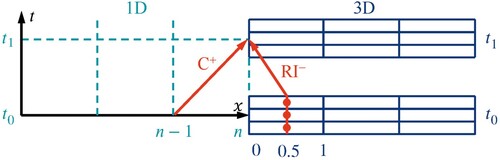
Figure 3. Brief composition of the solver code for 1D-3D coupled algorithm.
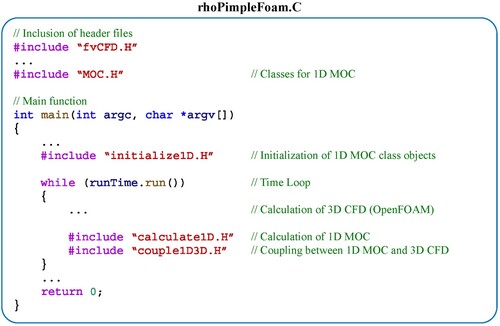
Figure 4. Schematic of mesh moving process for the radial gate.
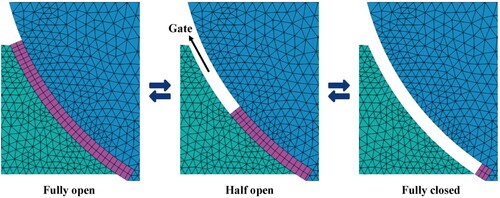
Figure 5. Layout of the reservoir-pipe-valve system.
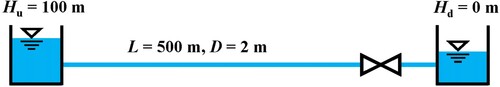
Table 1. Simulation conditions for the three typical water hammer cases.
Figure 6. Head histories on the upstream side of the valve for the reservoir-pipe-valve system: (a) direct water hammer; (b) first-phase water hammer; (c) last-phase water hammer.
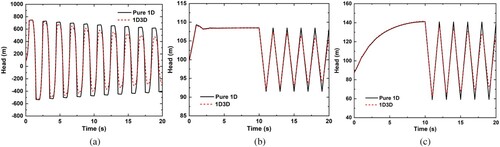
Figure 7. Comparison of the simulated and experimental results (Lobovský et al., Citation2014) for gas-liquid flow after quickly opening a gate.
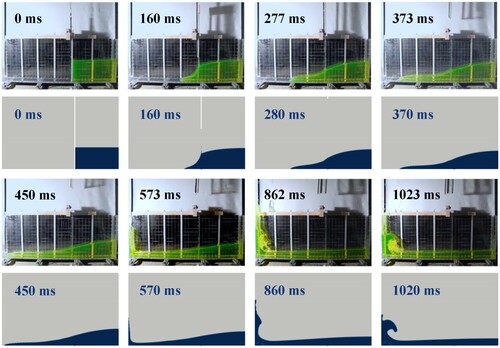
Figure 8. Schematic of the water conveyance system.
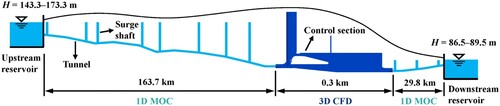
Figure 9. 3D geometry of the gate chamber fluid domain.
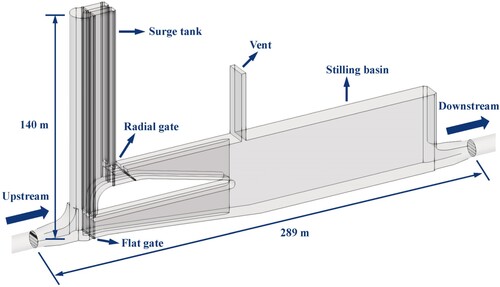
Figure 10. Mesh of the 3D computing domain.
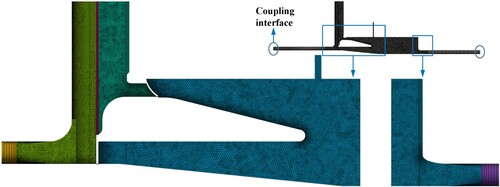
Table 2. Mesh independence verification results.
Table 3. Discretization schemes (fvSchemes).
Table 4. Boundary conditions for the main boundaries.
Table 5. The transient operating conditions simulated.
Figure 11. Histories of the water head and discharge at the inlet and outlet of the gate chamber under Close-1 condition: (a) water head; (b) discharge.
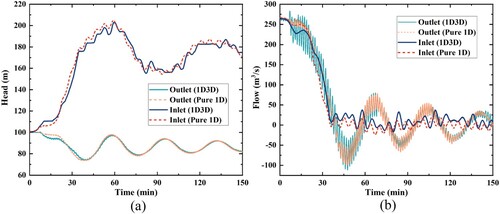
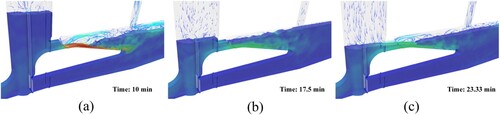
Figure 12. Variation of the flow patterns and water levels in the gate chamber under Close-1 condition.
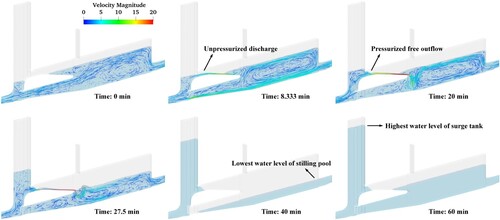
Figure 13. Water head distributions along the system under Close-1 condition.
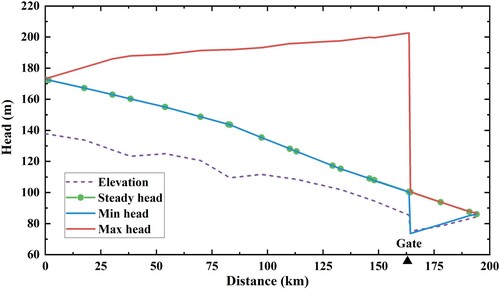
Figure 14. Histories of the water head and discharge at the inlet and outlet of the gate chamber under Open-1 condition: (a) water head; (b) discharge.
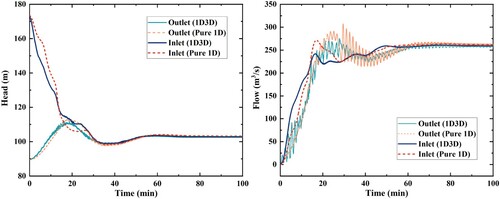
Figure 15. Variation of the flow patterns and water levels in the gate chamber under Open-1 condition.
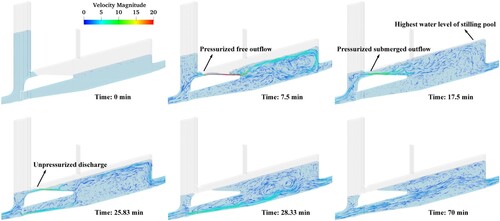
Figure 16. Water head distributions along the system under Open-1 condition.
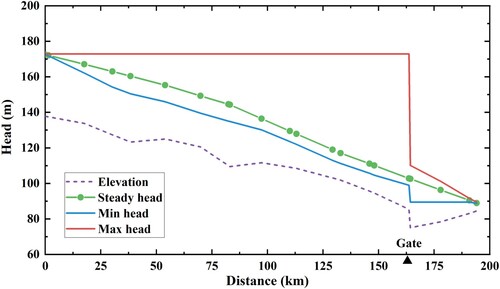
Figure 17. Various flow patterns for gate-controlled discharging flow: (a) pressurised free outflow; (b) pressurised submerged outflow; (c) unpressurised discharge.