
Figures & data
Figure 1. Schematic view of computational domain. (a) Typical section of bridge, (b) typical section of tunnel, and (c) schematic view of tunnel and bridge zones.
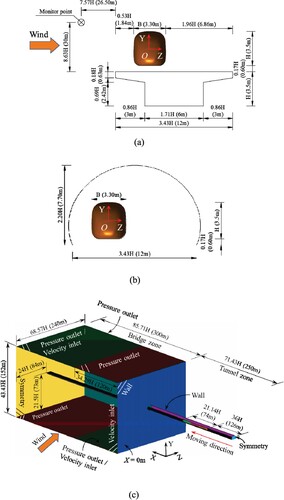
Figure 2. Schematic view of computational mesh. (a) Cross-sectional mesh schematic of tunnel zone, (b) cross-sectional mesh schematic of bridge zone, (c) mesh side view of motion region, and (d) mesh detail of motion region.
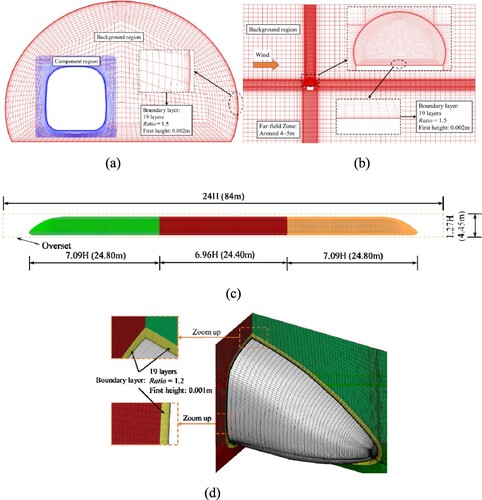
Figure 3. Sign convention of aerodynamic force components on the vehicle and location of the lines on the train surface.
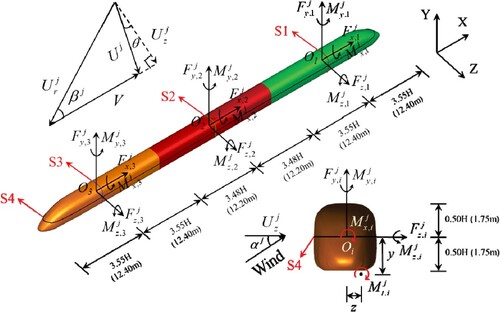
Figure 4. Numerical simulation model information of mountain terrain. (a) Computational mesh and boundary conditions and (b) wind profile of the velocity inlet.
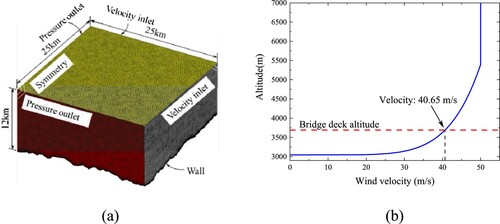
Figure 5. Results of mountain terrain numerical simulation in the bridge–tunnel section along bridge longitudinal. (a) Distribution of wind speed reduction coefficients and (b) distribution of wind attack angles.
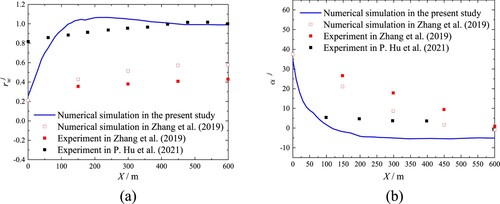
Figure 6. Results of monitor points along bridge longitudinal axis. (a) Distribution of wind speed reduction coefficients and (b) distribution of wind attack angles.
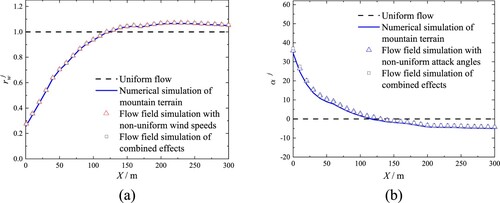
Figure 7. Results for different residual values. (a) Side force coefficient, (b) lift force coefficient, and (c) rolling moment coefficient.
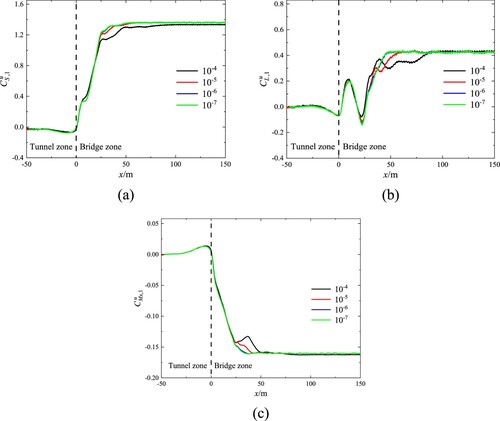
Table 1. Grid configuration in the grid independence verification.
Figure 8. Results for different grid settings. (a) Side force coefficient, (b) lift force coefficient, and (c) rolling moment coefficient.
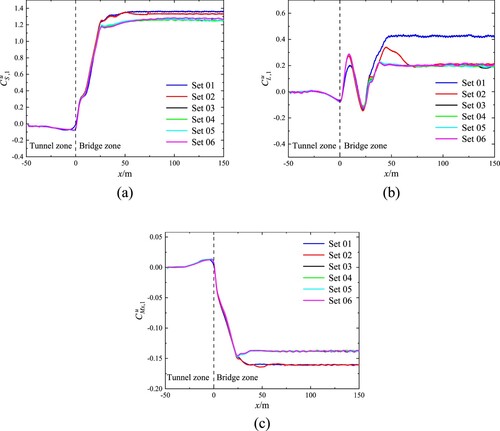
Figure 9. Photograph of train model in wind tunnel test.
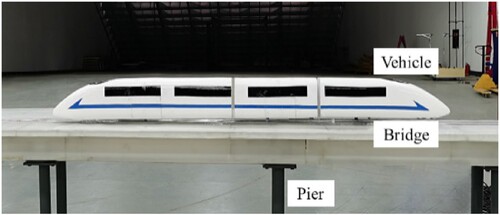
Table 2. Comparison between the wind tunnel test and simulation.
Figure 10. Aerodynamic coefficients of the head vehicle under uniform airflows and non-uniform wind speeds airflows. (a) , (b)
, (c)
, (d)
, (e)
, and (f)
.
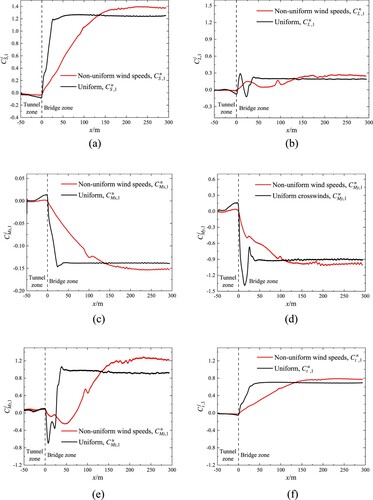
Figure 11. Flow field characteristics in the bridge–tunnel section. (a) Under uniform airflows and (b) under non-uniform wind speeds airflows.
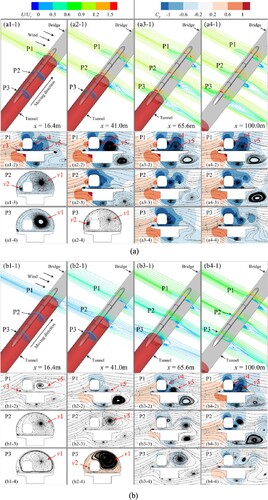
Figure 12. Distributions of the pressure coefficients for the S1, S2, and S3 (x = 41.0 m).
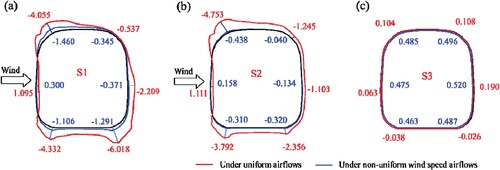
Figure 13. Distributions of the pressure coefficients for the S4 (x = 41.0 m). (a) Under uniform airflows and (b) under non-uniform wind speeds airflows.
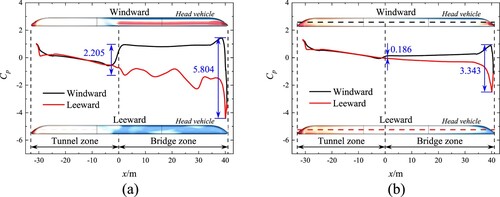
Figure 14. Aerodynamic coefficients under uniform airflows and non-uniform wind attack angles airflows. (a) , (b)
, (c)
, (d)
, (e)
, and (f)
.
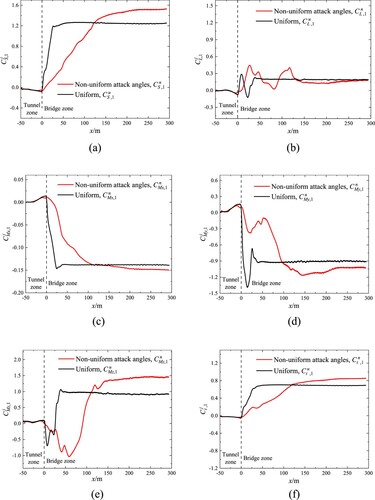
Figure 15. Flow field characteristics when the train moves in the bridge–tunnel section under non-uniform wind attack angles airflows.
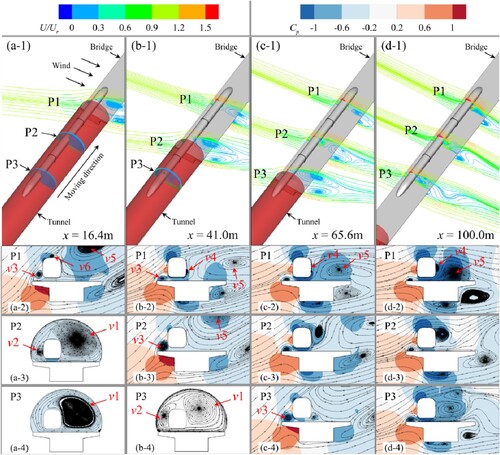
Figure 16. Distributions of the pressure coefficients for the S1, S2, and S3 under non-uniform wind attack angles airflows (x = 41.0 m).
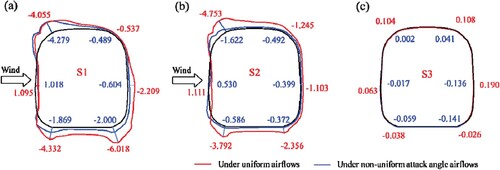
Figure 17. Distributions of the pressure coefficients for the S4 under non-uniform wind attack angles airflows (x = 41.0 m).
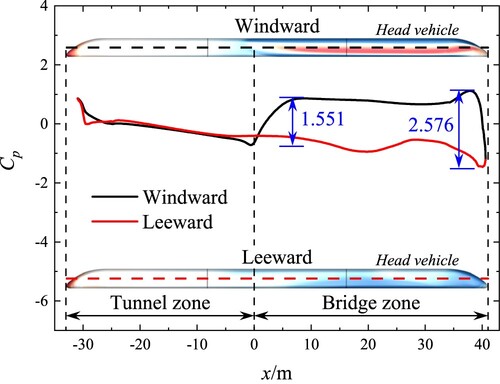
Figure 18. Aerodynamic coefficients under uniform airflows and non-uniform airflows. (a) , (b)
, (c)
, (d)
, (e)
, and (f)
.
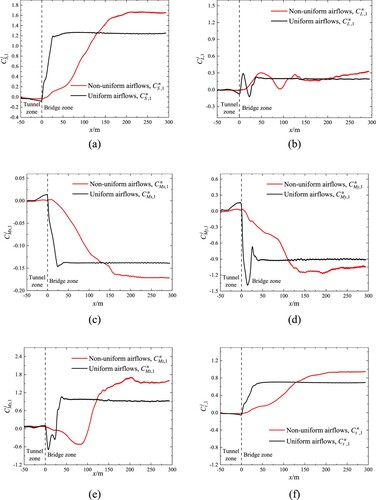
Figure 19. Flow field characteristics when the train moves in a bridge–tunnel section under non-uniform wind speeds and attack angles airflows.
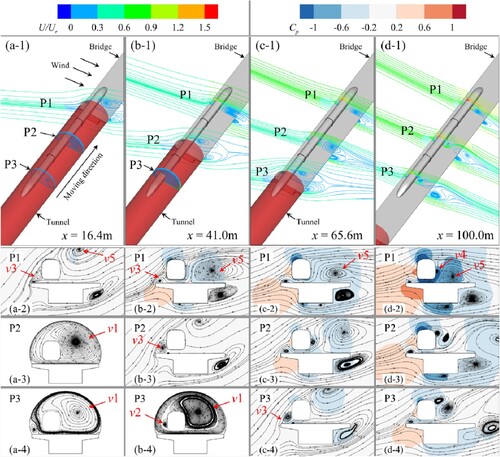
Figure 20. Distributions of the pressure coefficients for the S1, S2, and S3 under non-uniform wind speeds and attack angles airflows (x = 41.0 m).
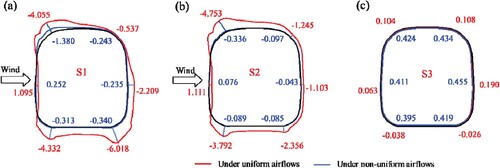
Figure 21. Distributions of the pressure coefficients for the S4 under non-uniform wind speeds and attack angles airflows (x = 41.0 m).
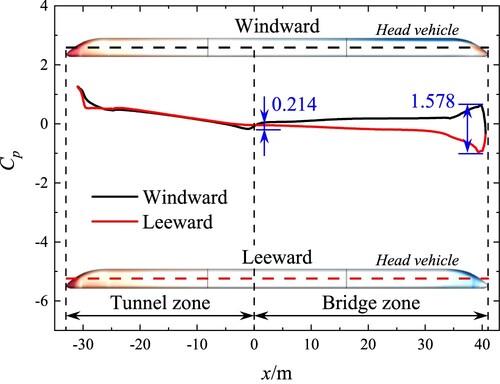
Figure 22. Local coordinate system of the vehicle.
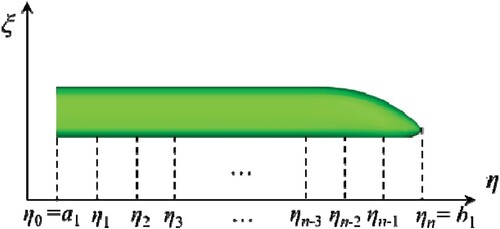
Figure 23. Overturning moment coefficients of head vehicle with different attack angles.
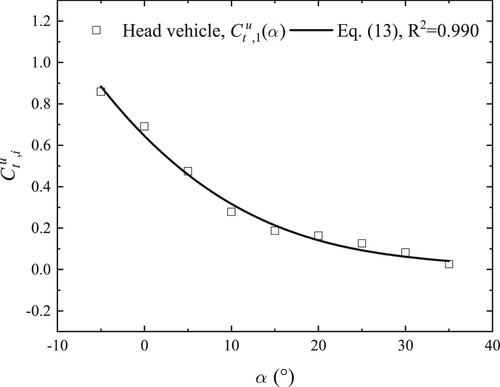
Figure 24. Results of numerical simulation and approximate calculation. (a) Results under non-uniform wind speeds airflows, (b) results under non-uniform wind attack angles airflows, and (c) results under non-uniform wind speeds and wind attack angles airflows.
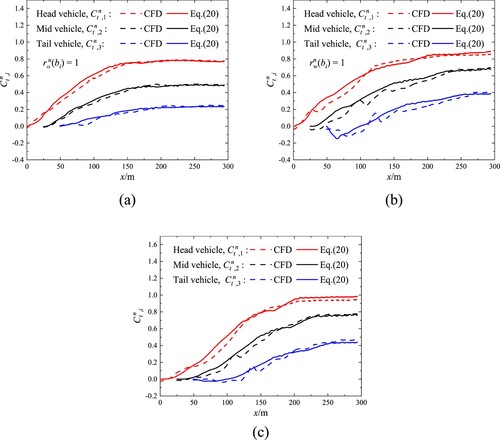
Table 3. Maximum absolute errors between numerical simulation and approximate calculation results.