
Figures & data
Figure 1. (a) Schematic illustration of factors affecting the penetration and dispersion characteristics of a needle-free jet injection system (NFJIS). Previously reported studies utilised the control of the pressurisation mechanism to achieve dynamic control, whereas in the present study we propose a system which could control the nozzle geometry to achieve the dynamic control. (b) A summary on penetration depth in skin tissue achieved by some of the previously reported NFJIS. The data is categorised based on the actuation mechanism by colour. An injection volume of 5 µL is used as the critical volume to divide between small- and large-volume injections.
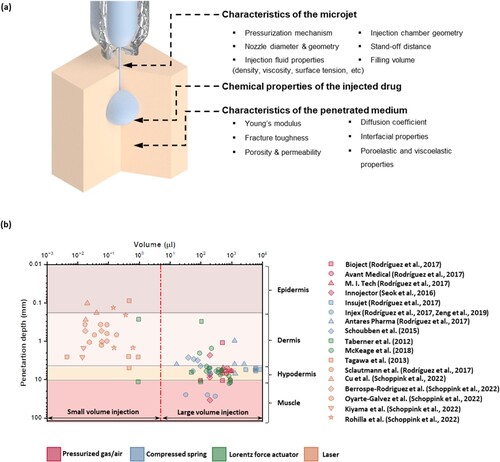
Figure 2. (a) Schematic representation of a possible version of the proposed system. In this system, a mechanical actuation can be used to obtain a pressurised fluid at the nozzle chamber, where a control-pin mechanism is used to control the nozzle geometry. The inset figures show the enlarged version of the nozzle chamber with critical dimensions and the two nozzle geometries investigated in the present study. The key dimensions are summarised in the Table . (b) The 2D axisymmetric computational domain with boundary conditions of the two nozzle geometries investigated in this study. (c) A schematic of the Simulink model used to obtain the displacement profile of the control-pin.
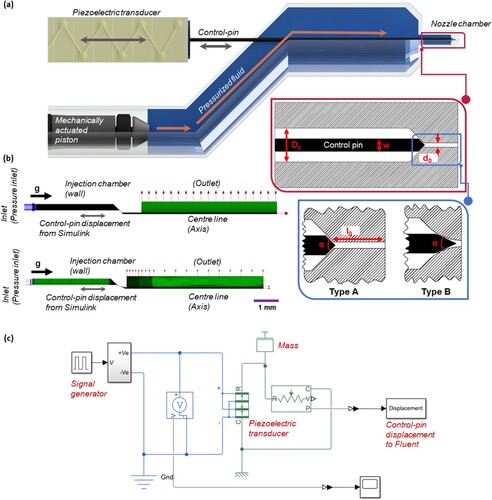
Table 1. Key dimensions and operating characteristics.
Figure 3. (a) A schematic of the limited experimental setup used for validating the model. The nozzle chamber and nozzle geometry were higher than the proposed system and was due to the constrains in our manufacturing capability. (b) The computational domain mimicking the dimensions and operating condition of the experimental setup and was used to validate the model.
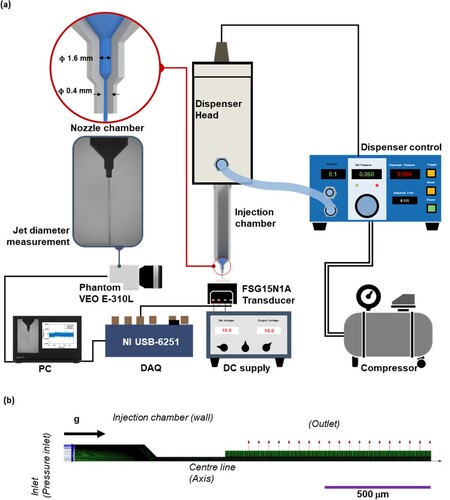
Figure 4. Operating principle of the proposed system. Here, a constant pressure of 10 MPa is used to pressurise the injection chamber where (a) a 150 V step input is given to the piezo transducer to achieve, (b) the displacement profile, and (c) the velocity of the control-pin. (d) The corresponding velocity and stagnation pressure characteristics of the propelled microjet. (e) The phase contour of the system for a pulse of operation.
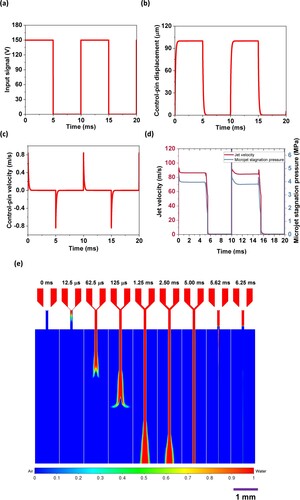
Table 2. Microjet velocity and penetration depth reported for various small-volume injections with the velocity in the range of this study.
Figure 5. (a) A comparison of the transient microjet stagnation pressure obtained from the experiment and the computational model when an inlet pressure of 0.4 MPa was applied. (b) Experimental and computed average steady-state microjet stagnation pressure for an inlet pressure of 0.4–0.6 MPa.
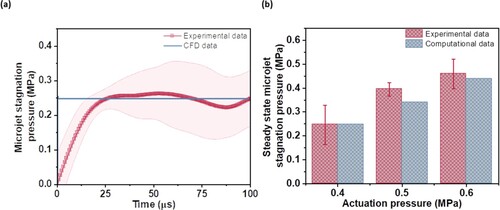
Figure 6. (a) Average and transient (a) microjet stagnation pressure and (b) velocity profile characteristics of the nozzle types A and B, calculated for 100 Hz step wave actuation of the control-pin.
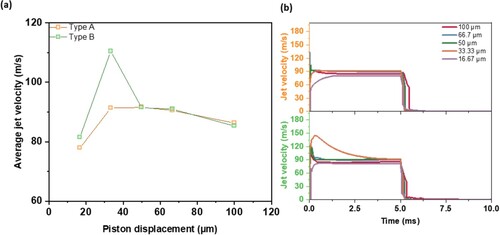
Figure 7. (a) Microjet velocity profile at nozzle exit for (a) type A and (b) type B nozzle. A value of 95% maximum velocity is considered for obtaining the boundary layer thickness (). Ninety-five percent of velocity is shown by the dashed lines. Inset plot shows the streamlines of flow in the nozzle for steady-state flow at 16.67 and 100 µm control-pin displacement. Colours indicate the magnitude of the velocity according to the colour bar given in (d). Scale bar = 100 µm. (c) Comparison of boundary layer growth for the two nozzle types with control-pin displacement at 100 Hz. (d) Velocity contour at 4 ms, fully developed steady-state flow for 100 µm displacement.
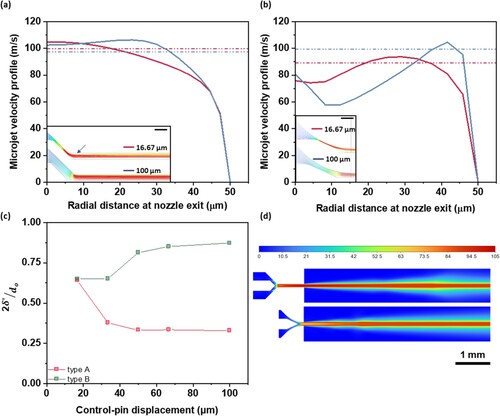
Figure 8. (a) Step, sinusoidal, and sawtooth activation profile for the control-pin and (b) their corresponding control-pin displacement. (c) Transient microjet velocity profiles for the actuation at 100 Hz.
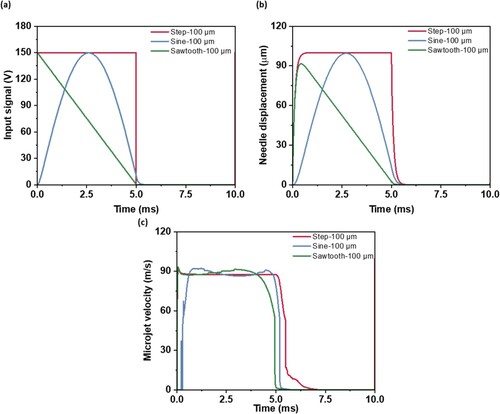
Figure 9. (a) The control-pin displacement profile when a step input with 150 V applied with frequencies of 100, 200, and 500 Hz. (b) The corresponding obtained microjet velocity profile of the proposed system. Oscillations in the profile is observed due to the entrapment of bubbles. (c) Phase contour water around the nozzle geometry when a steady jet is observed for repeated pulses (N = 2–5). Arrows show the bubble entrapment into the injection chamber for repeated pulses, which limits the operating frequency of the proposed system.
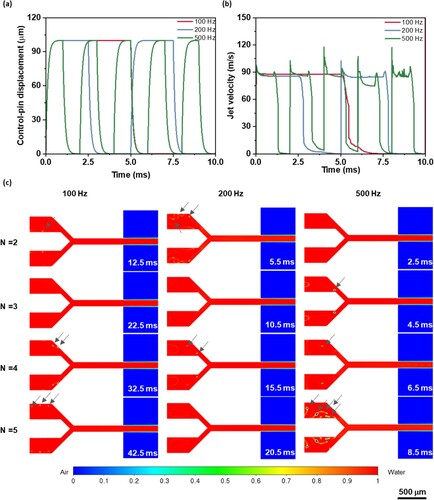
Table 3. Reported characteristics of the small-volume jet injections from literatures.
Supplemental Material
Download MS Word (254.2 KB)Supplemental Material
Download MS Word (254.2 KB)Data availability
Data underlying the results presented in this paper are not publicly available at this time but may be obtained from the authors upon reasonable request.