Figures & data
Figure 1. The stratification of the atmospheric boundary layer.
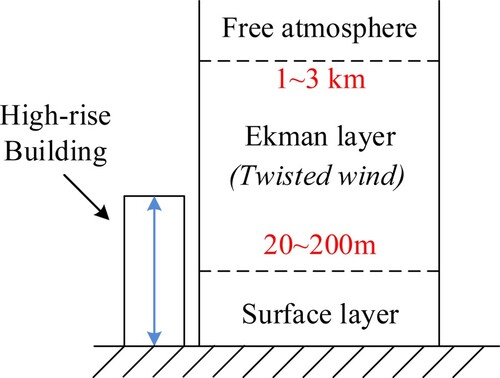
Figure 2. A schematic illustration of the Ekman spiral.
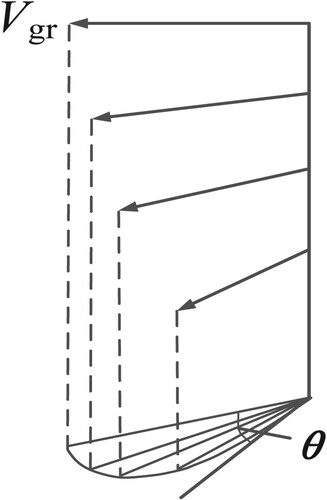
Figure 3. The DC Wind Tunnel Laboratory of Chongqing University, Chongqing, China.
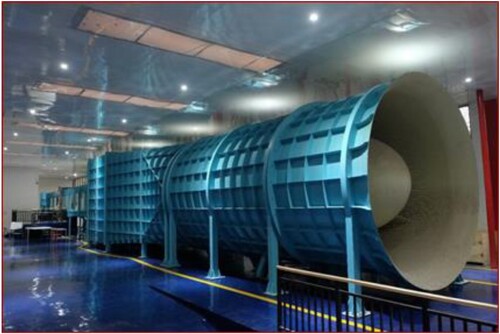
Figure 4. Twisted vanes (unit: mm): (a) 15° twisted vane; (b) 30° twisted vane.
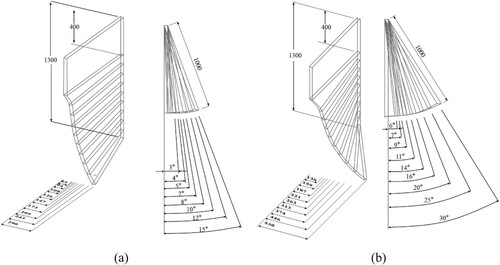
Figure 5. (a) A schematic diagram of the wind tunnel layout (unit: m); (b) Photo footage of the apparatus setup.
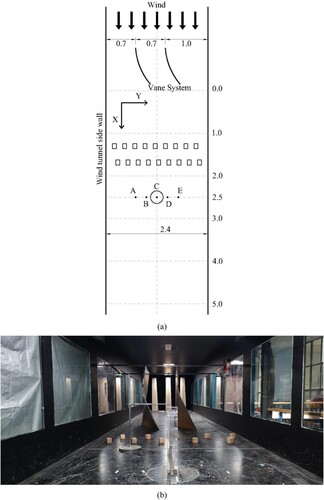
Figure 6. Test model dimensions and the distribution of measurement nodes (unit: mm).
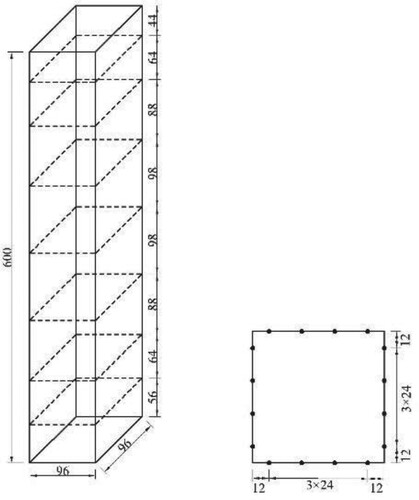
Figure 7. Computational field size and meshing: (a) computational field size; (b) meshing.
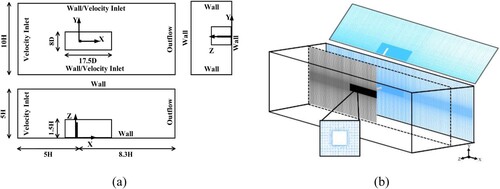
Table 1. LES solution condition setting.
Figure 8. The LESIQ index on Z = 0.5H Plane.
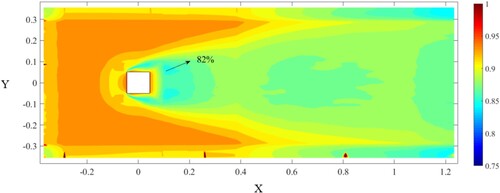
Figure 9. Global lift monitoring.
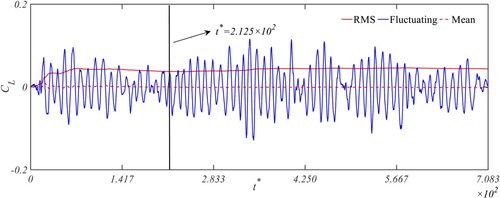
Figure 10. Comparison of mean wind profiles at different locations under different wind fields: (a) CWF (b) TWF15; (c) TWF30.

Figure 11. Comparison of the streamwise velocity and turbulence intensity profiles between the CWF and theoretical curve of GB50009-2012.
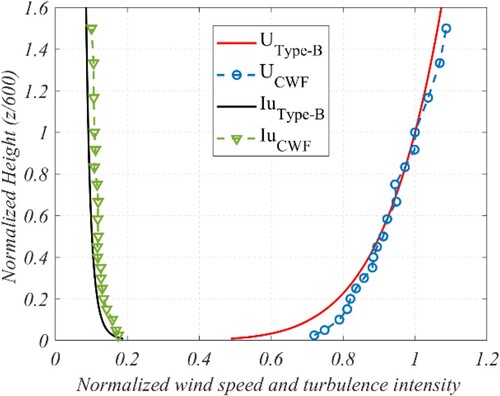
Figure 12. Comparison of the streamwise velocity and turbulence intensity profiles between (a) TWF15 and (b) TWF30 and the corresponding CWF.
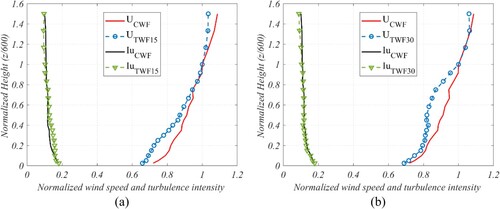
Figure 13. Comparison of the streamwise velocity and turbulence intensity profiles between wind tunnel test and CFD simulation for TWF15.
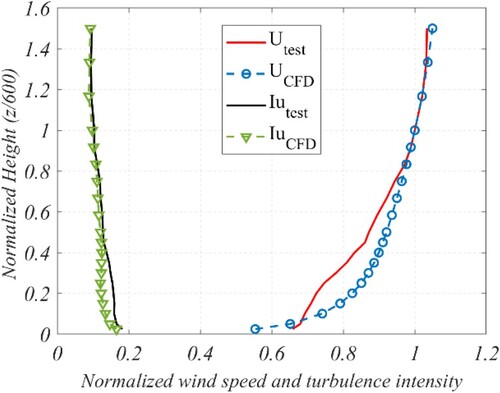
Figure 14. Comparison of the angle of twist between wind tunnel test and CFD.
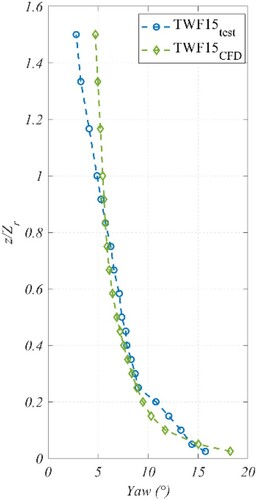
Figure 15. Comparison of the crosswind velocity between wind tunnel test and CFD.
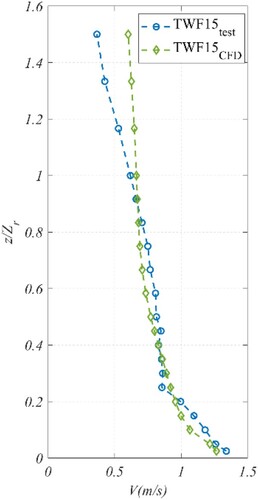
Figure 16. Comparison of the mean wind pressure coefficient between wind tunnel test and CFD under TWF15.
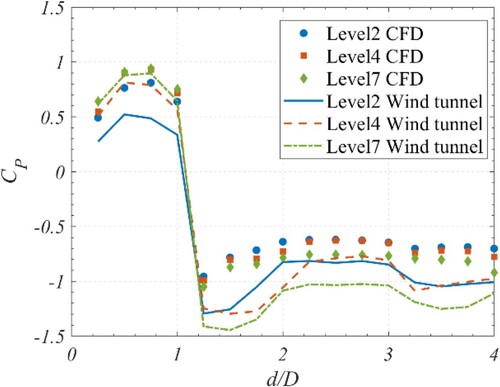
Figure 17. Turbulence Intensity comparison between test and theoretical
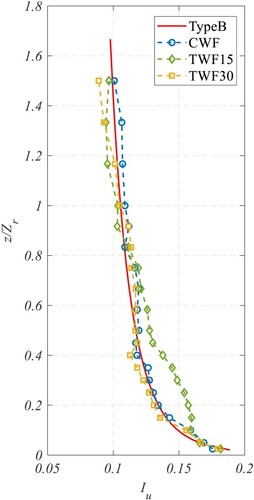
Figure 18. Crosswind speed comparison of TWFs
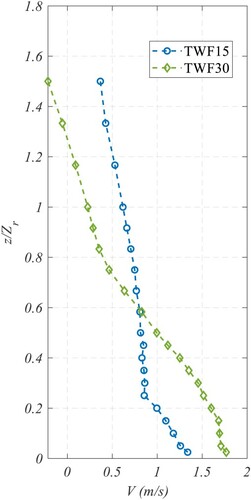
Figure 19. Comparison of twisted angle profile of TWFs
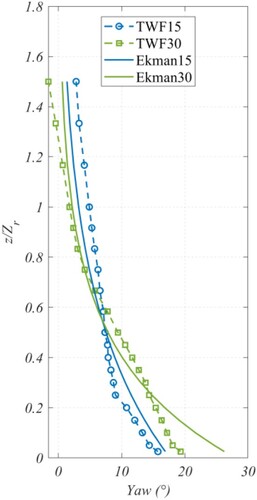
Figure 20. Fluctuating wind speed spectrum at structure height H, (a) downwind fluctuating spectrum and (b) crosswind fluctuating spectrum
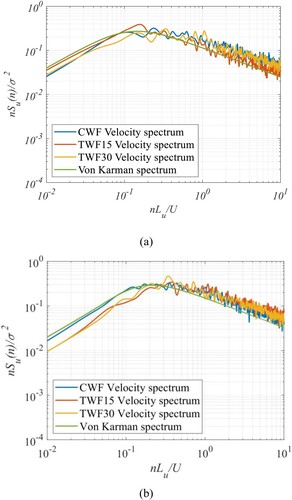
Figure 21. Comparison of average wind pressure coefficient distribution of isolated tall buildings under CWF and TWF.
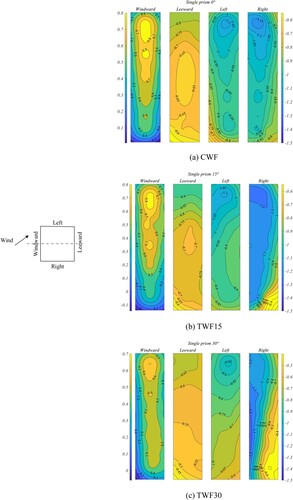
Figure 22. Comparisons of lift spectra of (a) CWF; (b) TWF15; (c) TWF30 at Levels 1, 4, and 7; comparisons of lift spectra of (d) Level 1; (e) Level4; (f) Level 7 under CWF, TWF15, and TWF30.
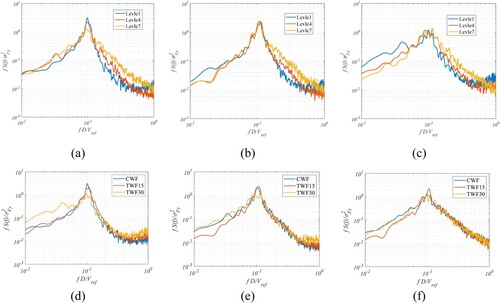
Figure 23. Comparisons of drag spectra of (a) CWF; (b) TWF15; (c) TWF30 at Levels 1, 4, and 7; comparisons of drag spectra of (d) Level 1; (e) Level4; (f) Level 7 under CWF, TWF15, and TWF30.
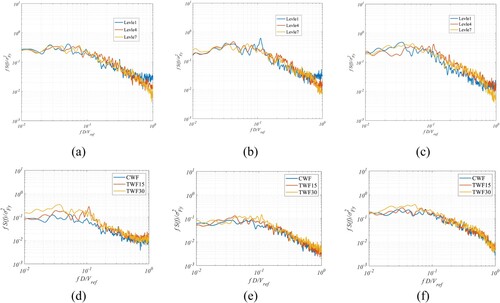
Figure 24. High-rise building sectional RMS force coefficient: (a) RMS lift coefficient; (b) RMS drag coefficient.
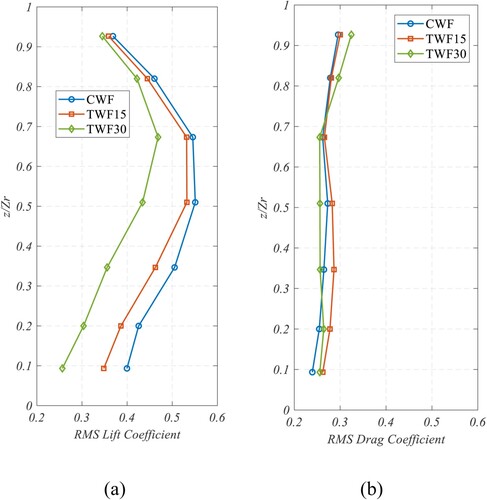
Figure 25. Streamline at different heights of building in CWF, TWF15, and TWF30: (a) Z = 0.1 m; (b) Z = 0.3 m; (c) Z = 0.5 m.
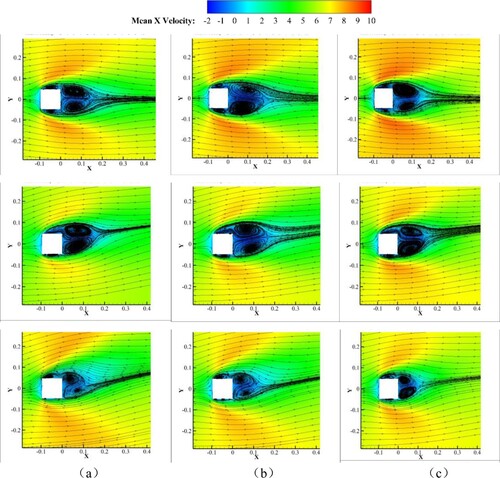
Figure 26. Vorticity graph at different heights of building in CWF, TWF15, and TWF30: (a) Z = 0.1 m; (b) Z = 0.3 m; (c) Z = 0.5 m.
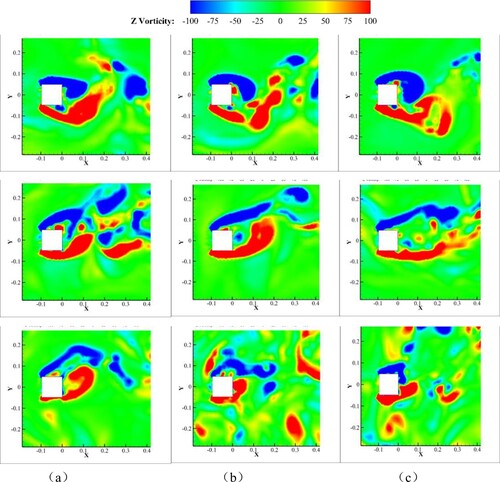
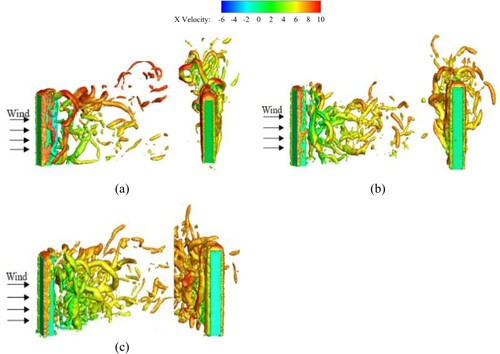
Figure 27. Q criterion level diagram of the high-rise building (Q = 5e5): (a) CWF; (b) TWF15; (c) TWF30.