Figures & data
Figure 1. Volute structures in the optimization design process of this study.
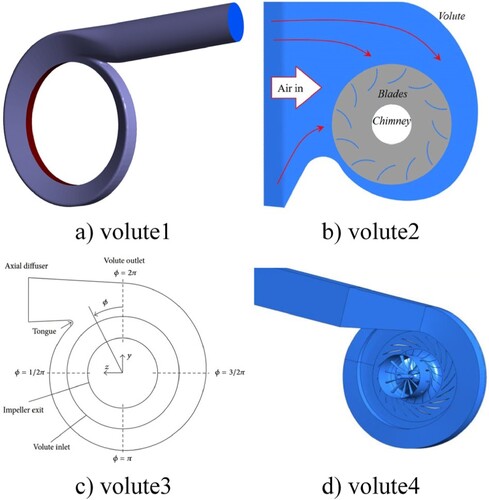
Figure 2. Cross-sectional view of the hydrodynamic retarder.
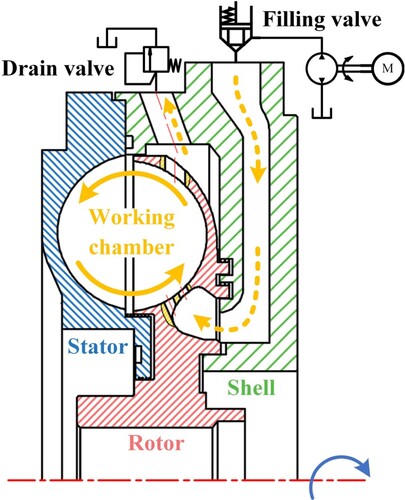
Figure 3. Flow channel model of the hydrodynamic retarder with an inlet and outlet.
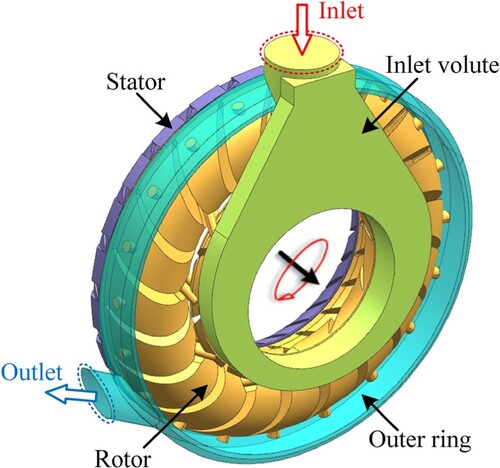
Table 1. Simulation parameters.
Table 2. Number of meshes with different sizes.
Figure 4. Results of grid convergence analysis.
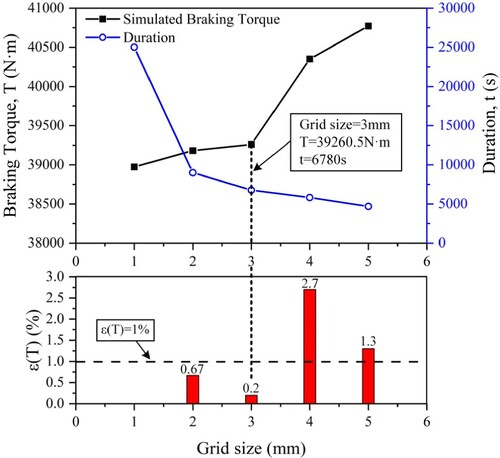
Figure 5. Hydrodynamic retarder mesh model (a) overall, (b) local.
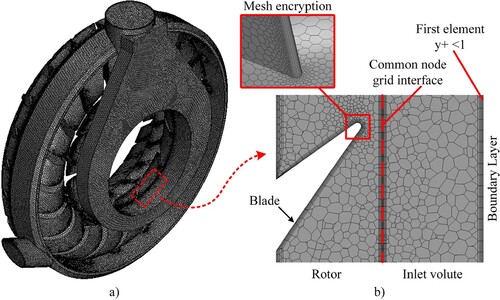
Figure 6. Distribution of y+ values near the wall of inlet volute and rotor blades.
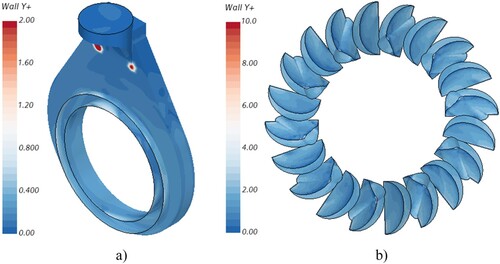
Table 3. Distribution of y+ value.
Figure 7. Introduction of the test rig.
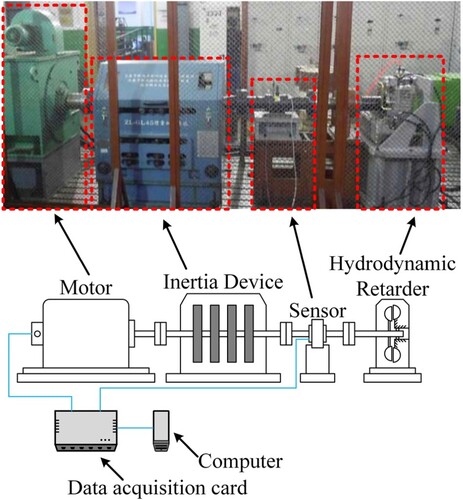
Figure 8. Comparison between simulation results and test data.
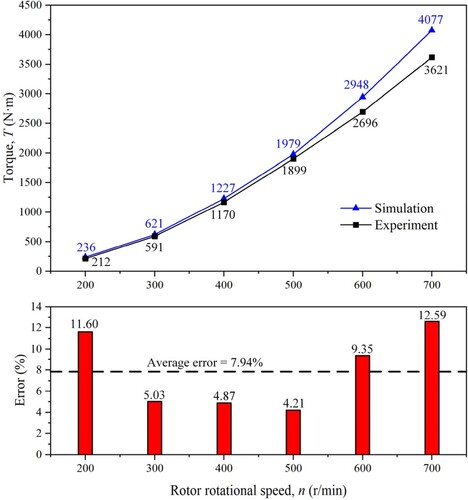
Figure 9. (a) Volute region division, (b) Typical cross-section oil distribution.
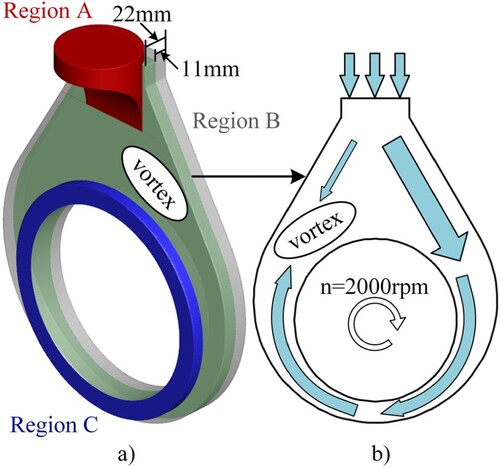
Figure 10. Nautilus cross-sectional shape.
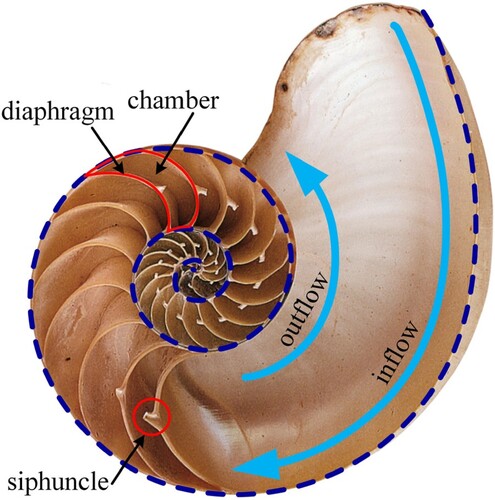
Figure 11. Cross-section profile of bionic nautilus hydrodynamic retarder volute.
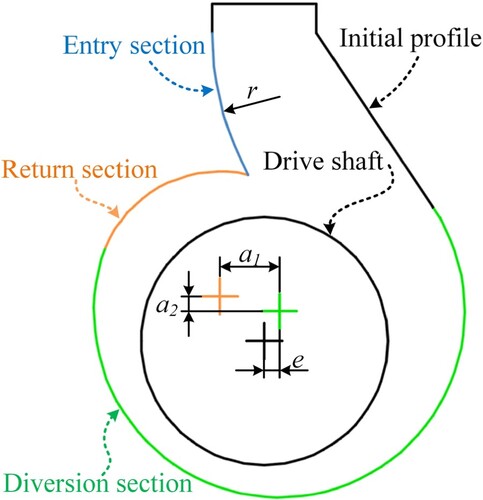
Table 4. Design variables and ranges of the volute.
Figure 12. Bionic volute optimization design process.
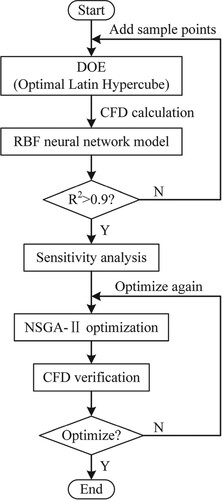
Figure 13. Training set volute cross-section profile.
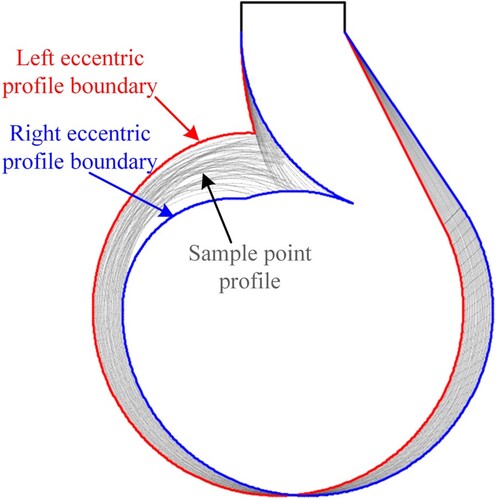
Figure 14. RBF neural network structure.
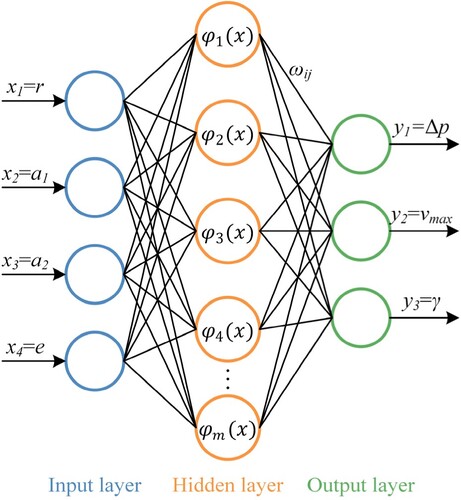
Table 5. Settings for NSGA-Ⅱ.
Figure 15. Correlation between optimization objectives and design variables.
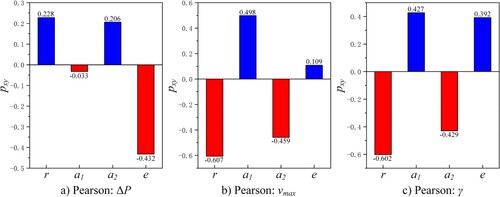
Table 6. Optimization trend of design variables.
Figure 16. Regression analysis for the surrogate model.
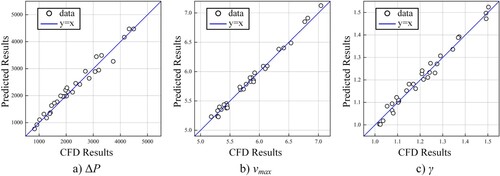
Table 7. R2 analysis results.
Figure 17. Computational Pareto frontier.
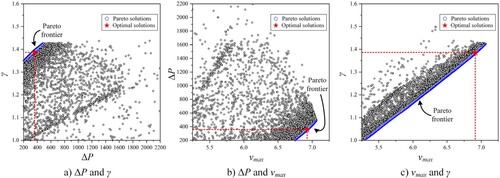
Figure 18. Comparison of profiles (a) prototype (b) bionic volute.
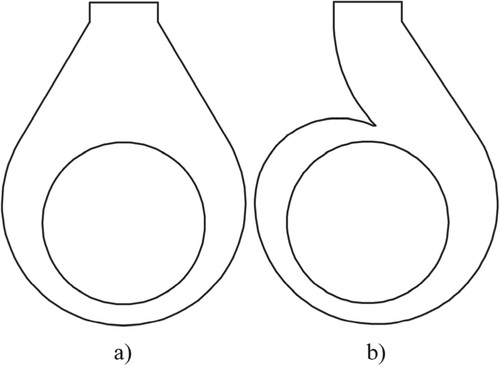
Table 8. Comparison of the objective function between the prototype and bionic volute.
Figure 19. Typical section velocity field and streamline diagram comparison.
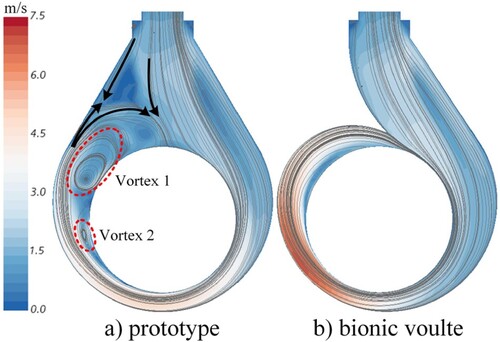
Figure 20. Flow field vortex identification comparison.
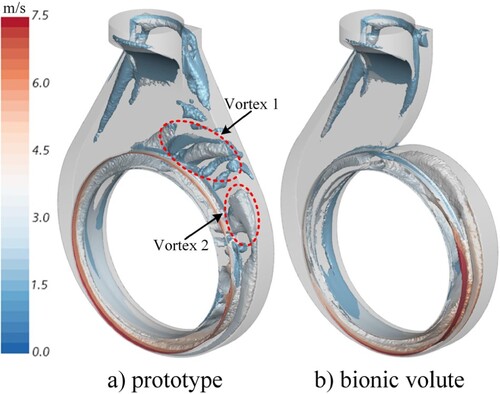
Figure 21. Comparison of outlet flow distribution.
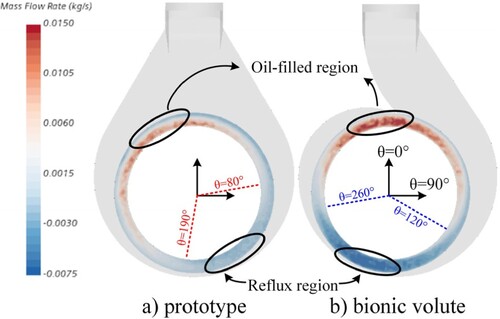
Figure 22. Comparison of pressure and velocity at the outlet of the volute.
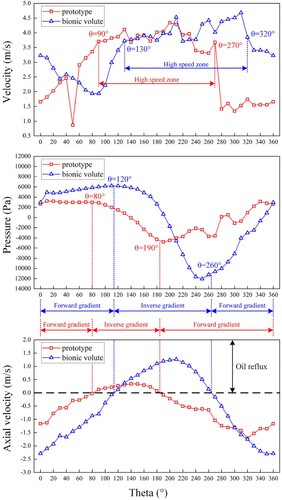
Figure 23. Comparison of flow energy loss distribution in the volute.
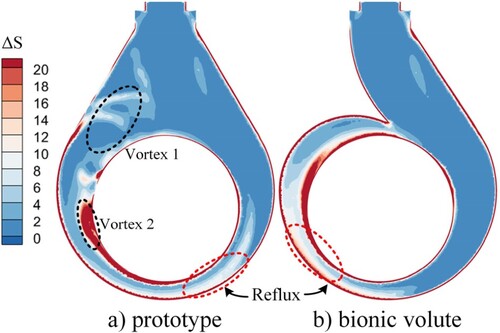
Figure 24. Emergency braking characteristics of the hydrodynamic retarder.
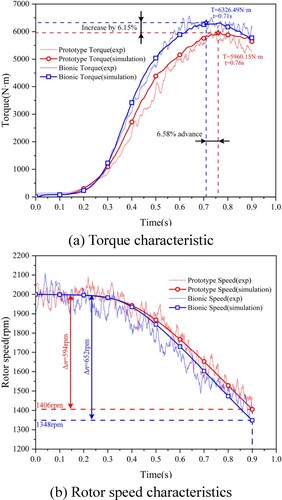
Table 9. Braking characteristic index of the hydrodynamic retarder.
Figure 25. Comparison of filling rate changes.
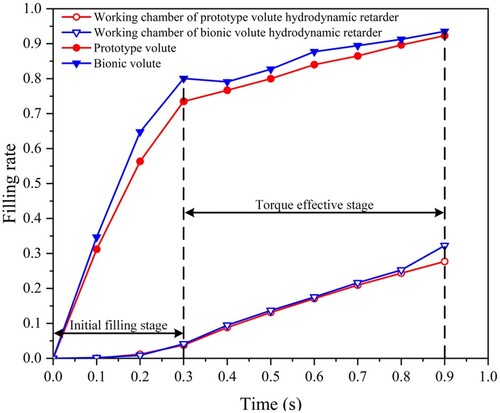
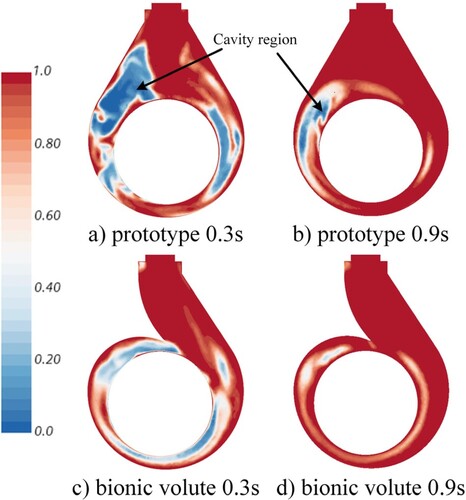
Figure 26. Gas-liquid two-phase distribution during liquid filling.