
Figures & data
Figure 1. ESP model.
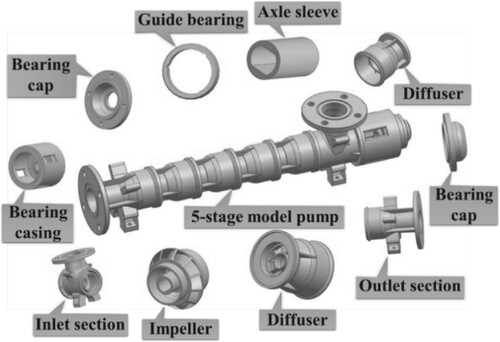
Figure 2. Computation-domain of ESP.
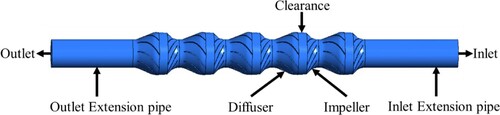
Figure 3. Meshing grid of the computational domain.
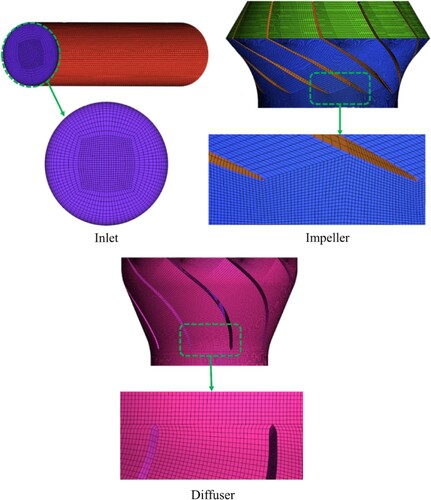
Figure 4. Mesh independence Analysis.
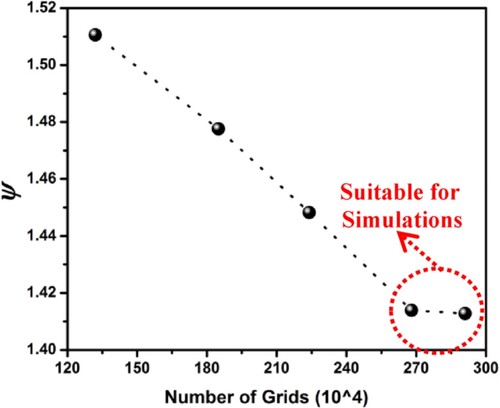
Figure 5. y+ assessment at impeller wall.
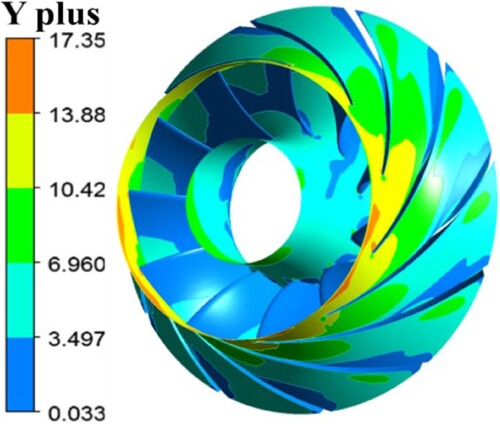
Figure 6. Fully constructed computational domain of ESP in ANSYS CFX-Pre.
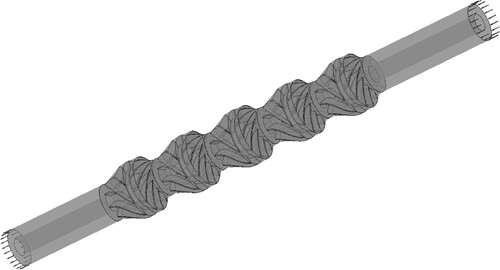
Figure 7. Complete arrangement of ESP system. (a) Complete arrangement of ESP installation within laboratory. (b) inter-stage assembly of ESP. (c) Air admission device.
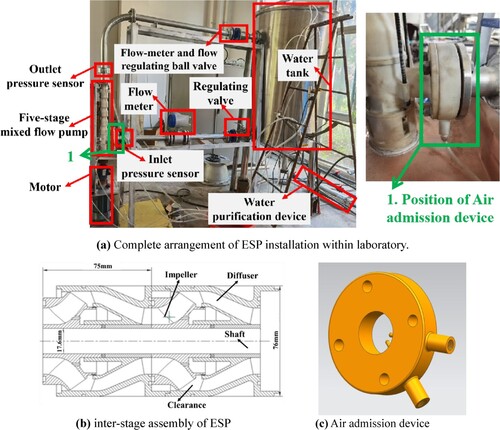
Table 1. Designed parameters of the prototype pump model.
Figure 8. Diagrammatic representation of the ESP operating under multiphase flow test system.
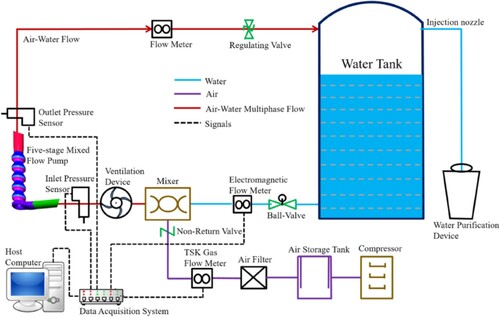
Figure 9. Complete acquisition-process of signal acquisition.
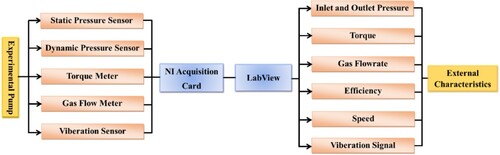
Figure 10. ESP’s performance characteristic curve in single-phase flow environment.
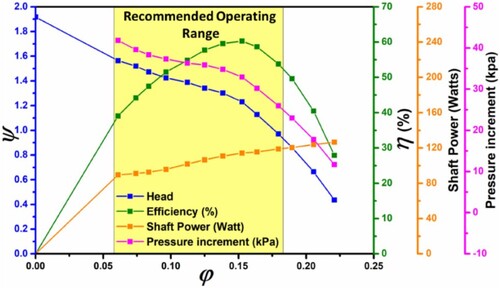
Figure 11. ESP’s performance characteristic curve in the presence of two-phase flow circumstances.
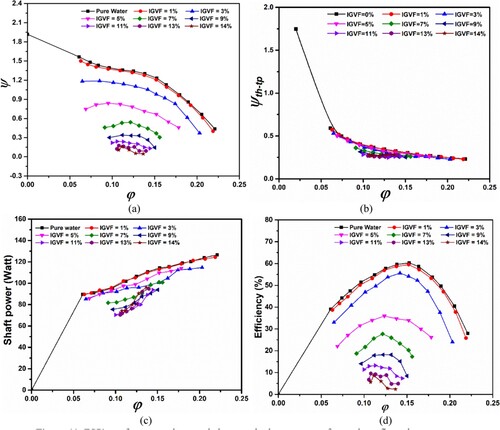
Figure 12. Head characteristic curve of ESP at different flow rates under two-phase flow conditions.
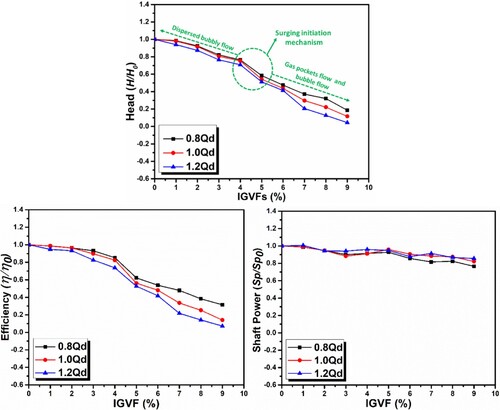
Figure 13. Comparison of experimental and numerical results.
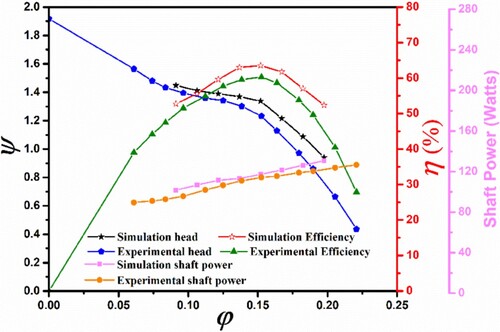
Figure 14. Static pressure contours of ESP at single-phase flow.
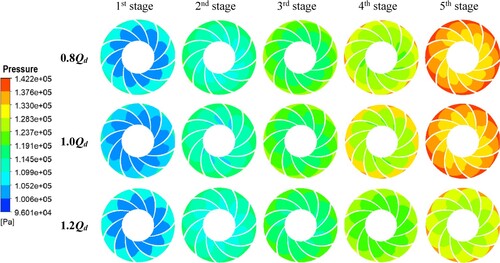
Figure 15. Velocity streamline distribution of ESP at single-phase flow.
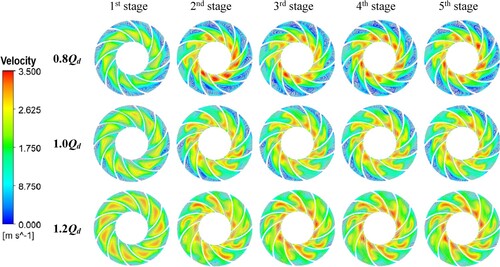
Figure 16. Comparative analysis between Two different multiphase models.
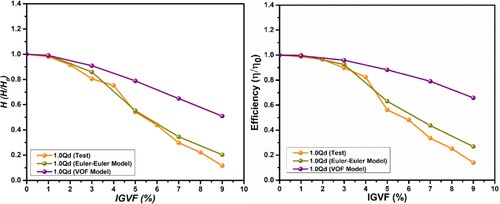
Figure 17. Comparison of test and simulation performance curves under two-phase flow. (a) Head; (b) Efficiency; (c) Shaft power.
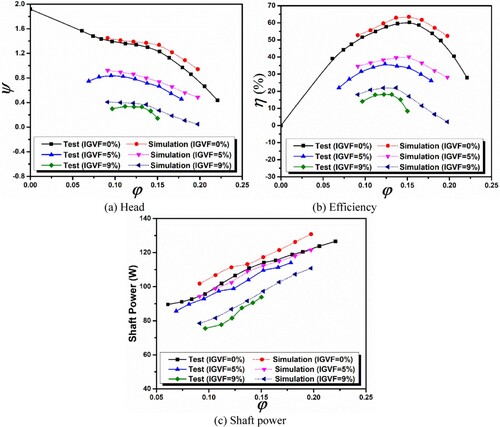
Figure 18. Simulated outcomes for ESP-performance on each stage impeller. (a) pure water condition; (b) two-phase flow conditions when Qd = 7.5 m3/h (φ = 0.152).
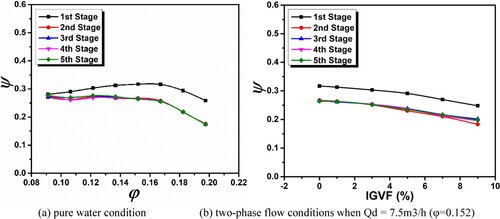
Figure 19. Gas distribution trend in middle section of 1st stage impeller of ESP at distinct IGVF and flowrate.
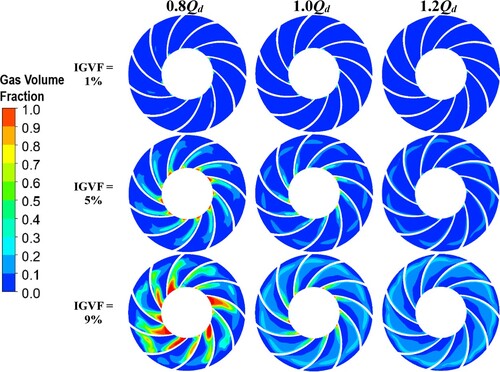
Figure 20. Volume distribution of the gas contents on the first stage impeller’s cross-section at various rotational positions.
Note: Working conditions (IGVF = 9%, and 1.0Qd). (a) 0°; (b) 30°; (c) 60°; (d) 90°; (e) 120°; (f) 150°.
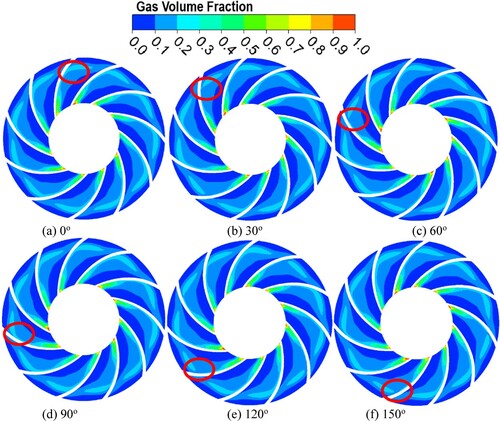
Figure 21. Gas velocity streamlines at the centre of 1st stage impeller of ESP at distinct IGVF and flowrate.
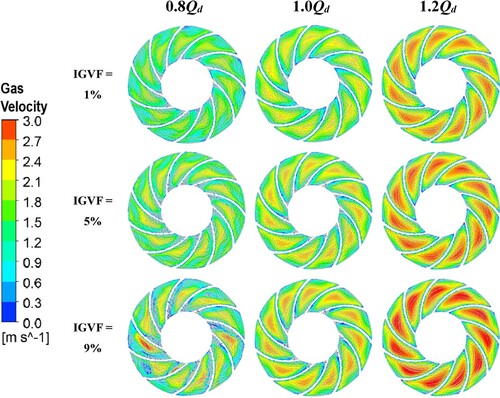
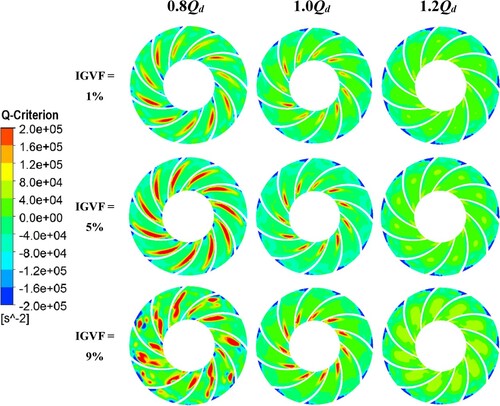
Figure 22. Vortex structures at the centre of 1st stage impeller of ESP at different IGVF and flowrate.
Data availability
The data supporting this study’s findings are available from the corresponding author upon reasonable request.