
Figures & data
Figure 1. Field conditions of the circular forebay: (a) illustrating the flow pattern in the Y-shaped diversion channel; (b) showing the location and direction of the vortex flow pattern in a circular inlet tank; (c) demonstrating sediment deposition in the Y-shaped diversion channel. These Figures were captured during the authors’ field research in 2022.
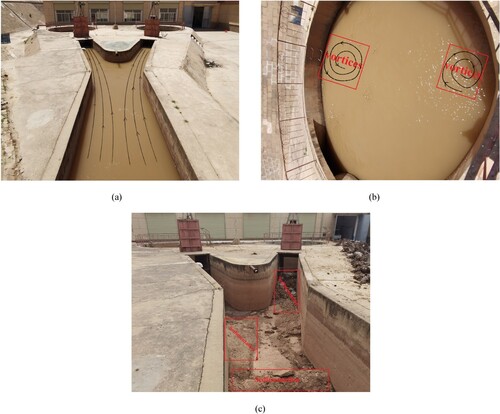
Figure 2. Geometric dimensions of the circular forebay.
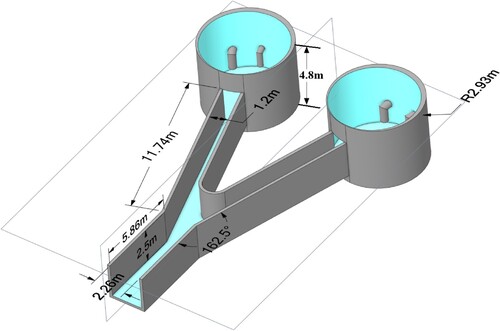
Figure 3. Computational Grids.
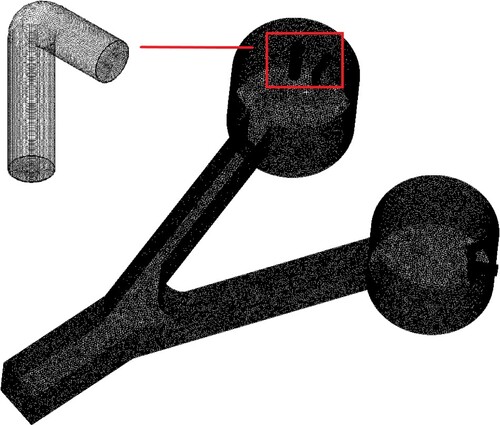
Figure 4. Hydraulic losses in circular forebays with different numbers of grids.
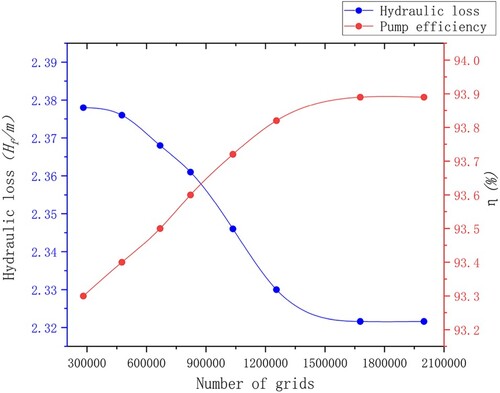
Table 1. Water and Sediment Statistics (2013–2020).
Figure 5. Three-dimensional distribution of the flow field in the circular forebay: (a) top view; (b) bottom view.
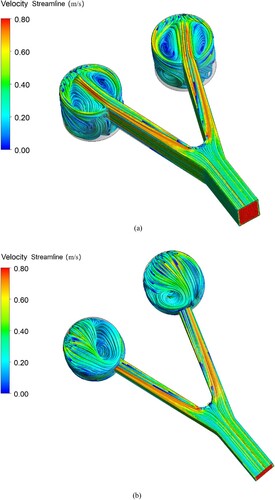
Figure 6. Distribution of streamlines and sediment content in various cross-sections: (a) y2 cross-section; (b) y1 cross-section.
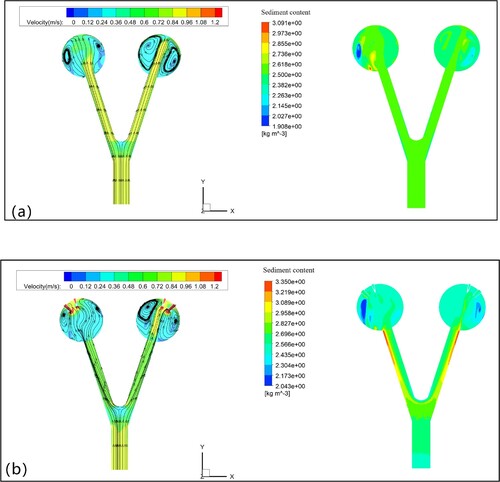
Figure 7. Bottom sill layout.
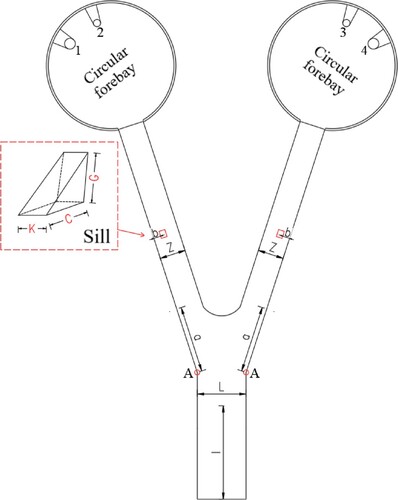
Table 2. Configuration of Simulation Schemes 1–3.
Table 3. Configuration of Simulation Schemes 4–9.
Table 4. Configuration of Simulation Scheme 10.
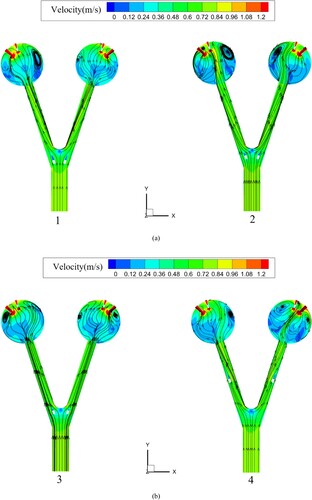
Figure 9. Water pressure plate layout.
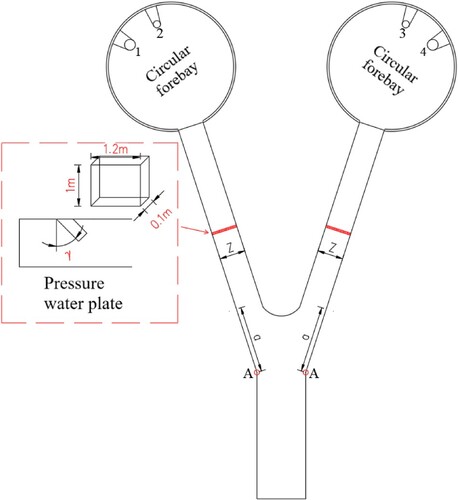
Table 5. Configuration of Simulation Schemes 11–20.
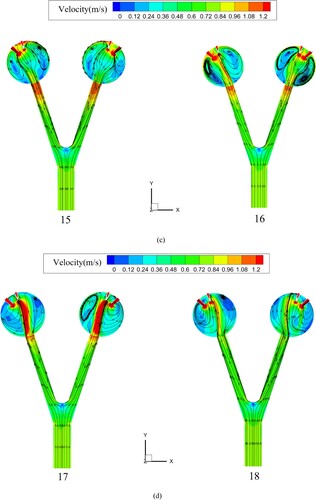
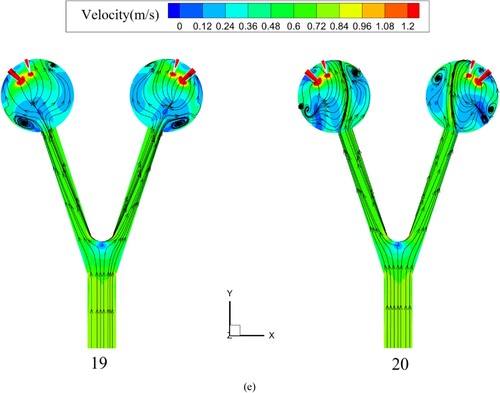
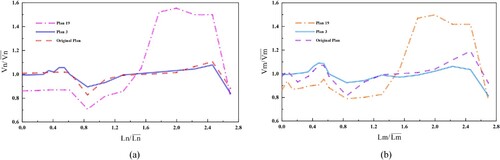
Table 6. Calculation of the flow velocity uniformity and deflection angle for cross-section y1.
Table 7. Estimated Vortex Reduction Values for Different Rectification Measures.
Figure 11. Physical model device for circular forebay.
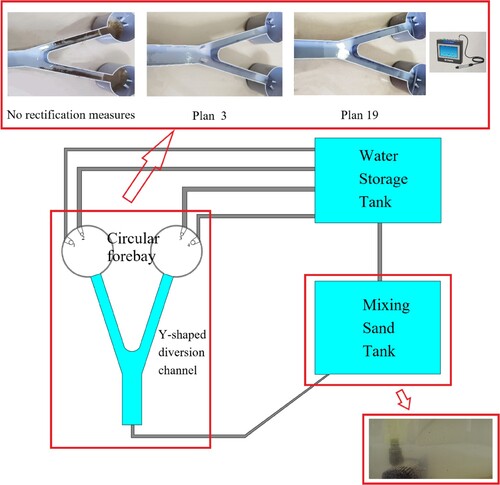
Figure 12. Comparison between the numerical simulation and measured sediment content of section y1: (a) Original Scheme; (b) Scheme 3; (c) Scheme 19.
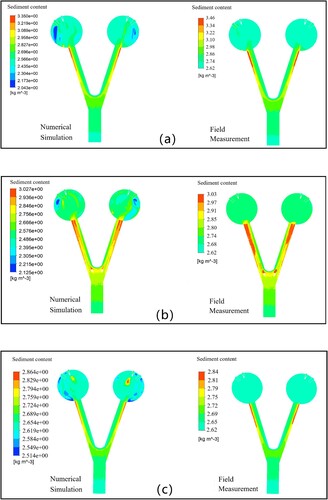
Figure 13. Comparative analysis of numerical simulation and measured results: (a) Numerical simulation; (b) Filed measurement results.
Data availability statement
The data that support the findings of this study are available from the corresponding author upon reasonable request.