Figures & data
Figure 1. Biofilm characterization flowchart. ECM, extracellular matrix; eDNA, extracellular DNA; WSP, water-soluble polysaccharide; ASP, alkali-soluble polysaccharide.
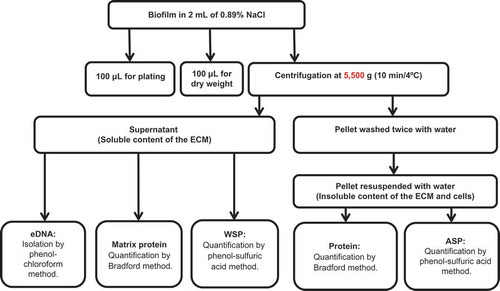
Table 1. Biofilm and extracellular matrix (ECM) components of Candida albicans biofilms.a
Table 2. Pearson’s correlation (r) of colony count (log10 cfu mL−1) and extracellular matrix (ECM) components for the wild-type (WT) strain (SN425).
Table 3. Pearson’s correlation (r) of colony count (log10 cfu mL−1) and extracellular matrix (ECM) components for the Δ/Δ efg1 mutant strain (CJN2302).
Table 4. Pearson’s correlation (r) of colony count (log10 cfu mL−1) and extracellular matrix (ECM) components for the Δ/Δ tec1 mutant strain (CJN2330).
Figure 2. Visual macroscopic appearance and overall Candida albicans biofilm structure by variable-pressure scanning electron microscopy (VPSEM). The wild-type (WT) strain presents a typical thick biofilm architecture in visual appearance (a) with the presence of abundant extracellular matrix (ECM) (b, c), exemplified by the arrows (c). The Δ/Δ efg1 mutant shows sparse thin biofilm growth patterns (d) and an ECM (e, f) morphologically distinct from the WT (b, c) and Δ/Δ tec1 strains (h, i). The Δ/Δ tec1 mutant presents defects in visual appearance (g) compared to the WT strain (a); however, its ECM is morphologically similar to the WT (h, i, see arrows).
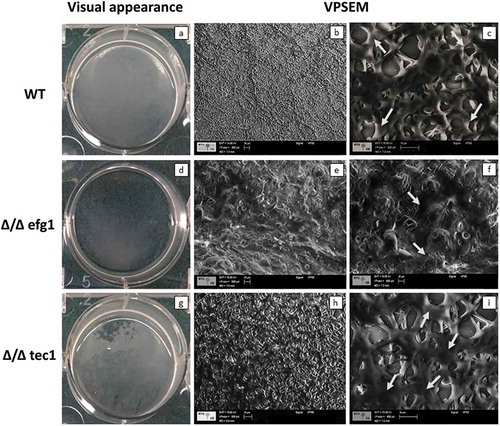
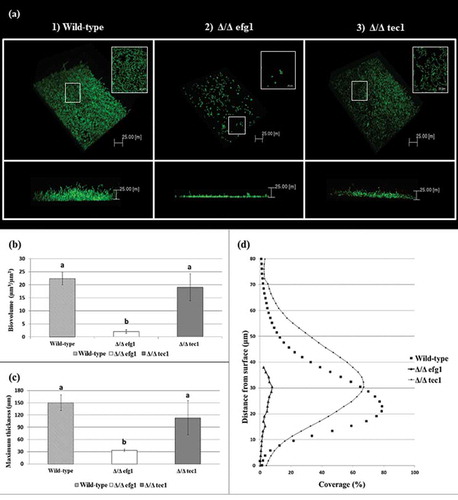
Figure 3. Candida albicans biofilm structures and corresponding quantitative data from confocal scanning laser microscopy assays. (a) Representative three-dimensional and orthogonal images of the structural organization of the 48 h biofilms of C. albicans wild-type (WT) (1) and mutant strains: Δ/Δ efg1 (2) and Δ/Δ tec1 (3) (green color denotes labeling with SYTO9 for live yeast cells). Mean and SD of biovolume (b) and average biofilm thickness (c) of C. albicans WT and mutant strains (Δ/Δ efg1 and Δ/Δ tec1) determined by COMSTAT2 analysis. The average biovolume and biofilm thickness were calculated from five independent samples from each strain. Values followed by the same letter are not significantly different (p > 0.05), as determined by an analysis of variance for all pairs using Tukey’s test. The profile of the distribution of C. albicans WT and mutant strains (Δ/Δ efg1 and Δ/Δ tec1) in the biofilms is represented in (d).