Figures & data
Table 1. Clinical information in patients with pancreatic head carcinoma and healthy controls.
Figure 1. Phylogenetic diversity of tongue coating microbiota among individuals and between PC patients and healthy subjects.
(a) Rarefaction analysis of bacterial 16S rRNA gene sequences was used to evaluate if further sequencing would likely detect additional taxa, indicated by a plateau. (b) Richness index curves that evaluate the number of samples likely required to identify additional taxa indicated by a plateau. (c) Scatterplots depict microbiota diversity differences according to the Shannon index, Simpson index and invsimpson index between the PCT and HT. (d) Scatterplots depict microbiomes diversity differences according to the Obs index, Chao 1 index and ICE index between PCT and HT. Plot parameters, the ‘black line’ symbol represents median value, and the upper and lower ranges of the plots represent the 75% and 25% quartiles, respectively. PCT, pancreatic cancer patients tongue coat; HT, healthy subjects tongue coat.
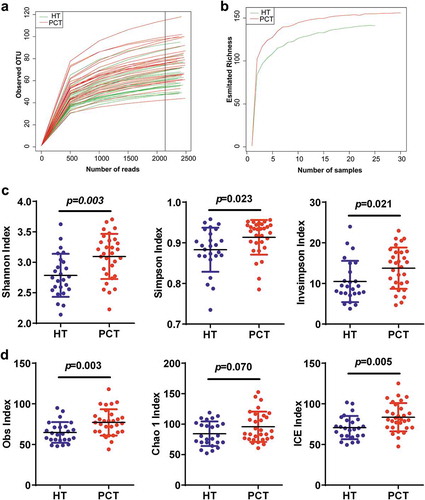
Figure 2. Bacterial diversity clustering by combining unweighted and weighted UniFrac PCoA of tongue coating microbiota.
(a) Unweighted UniFrac (qualitative); (b) weighted UniFrac (qualitative). Each symbol represents a sample (blue, PCT; green, HT); the variance explained by the PCs is indicated in parentheses on the axes. PCT, pancreatic cancer patients tongue coat; HT, healthy subjects tongue coat.
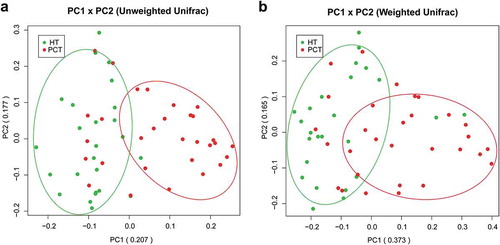
Figure 3. Heat maps of the relative abundances of the discriminatory OTUs that drive the differences between PCT and HT.
For each sample, the columns show the relative abundance data of the discriminatory OTUs listed to the right of the figure. The relative abundance of each OTU was used to plot the heat map (blue, low abundance; red, high abundance). The group information was shown above the plot: healthy controls on the left with green line, PC patients on the right with red line. Each row represents one OTU. The family and genus of each key OTU are noted to the right of the figure. The top six OTUs were found enriched in healthy controls, and the rest OTUs enriched in pancreatic cancer patients. PCT, pancreatic cancer patients tongue coat; HT, healthy subjects tongue coat.
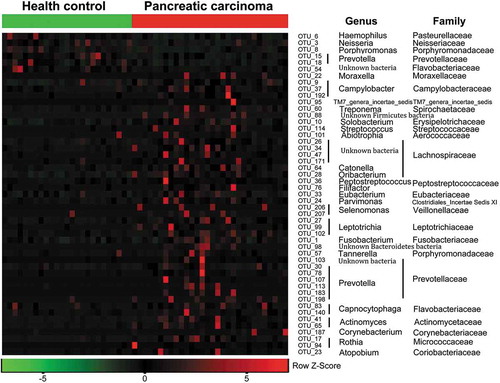
Figure 4. Comparison of the microbiome at the family (a) and genus (b) levels between PCT (red) and HT (green), respectively.
Box parameters, the ‘+’ symbol represents median value, and the upper and lower ranges of the box represent the 75% and 25% quartiles, respectively; P values were calculated using the nonparametric Mann–Whitney test and were shown in Supplementary Datasets S2_b (Family) and_c (Genus); significant correlations by *P < 0.05; **P < 0.01 and ***P < 0.001. PCT, pancreatic cancer patients tongue coat; HT, healthy subjects tongue coat.
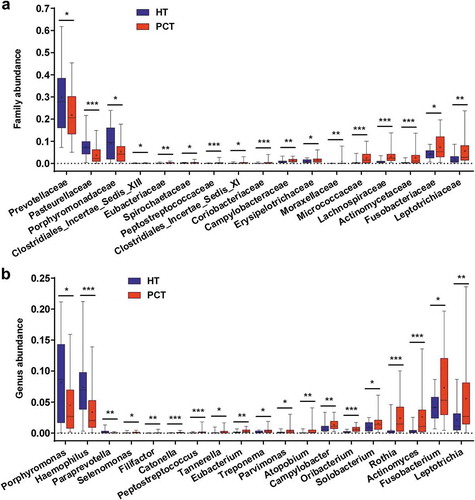
Figure 5. LEfSe and LDA analysis based on OTUs characterize microbiota between the PCT and HT.
(a) Cladogram using the LEfSe method indicating the phylogenetic distribution of tongue coat microbes associated with patients with PC (green indicates phylotypes statistically overrepresented in PCT) and healthy subjects (red indicates phylotypes overrepresented in healthy subjects). Each filled circle represents one phylotype, and phylum and class are indicated in their names on the cladogram and the order, family, or genera are given on the right panel. (b) A histogram of the linear discriminant analysis (LDA) scores was calculated for the selected taxa which showed the significant bacterial difference between the PCT and HT. LDA score at the log10 scale is indicated at the bottom. The greater the LDA score is, the more significant the microbial biomarker is in the comparison. (c) Prediction of microbial index (MI, the key genera which can distinguish PC patients from healthy controls). The area under the ROC curve (AUC = 0.862) and microbial index (Porphyromonas, Leptotrichia and Fusobacterium) were calculated and is shown in the center. PCT, pancreatic cancer patients tongue coat; HT, healthy subjects tongue coat; MI, microbial index.
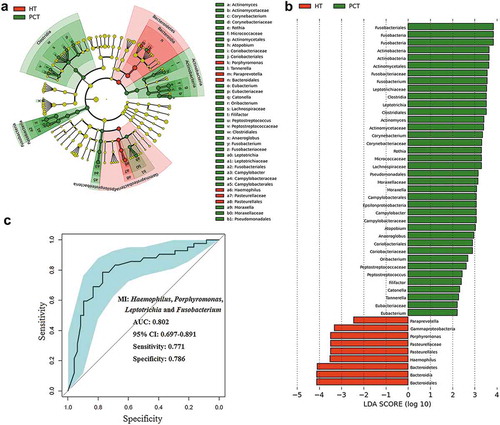
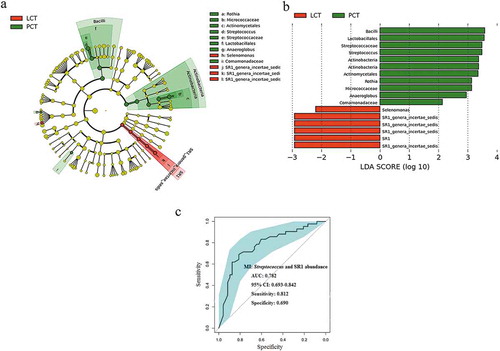
Figure 6. LEfSe and LDA analysis based on OTUs characterize microbiota between the PCT and LCT.
(a) Cladogram using the LEfSe method indicating the phylogenetic distribution of tongue coat microbes associated with patients with PC (green indicates phylotypes statistically overrepresented in PCT) and LC (red indicates phylotypes overrepresented in LCT). Each filled circle represents one phylotype, and phylum and class are indicated in their names on the cladogram and the order, family, or genera are given on the right panel. (b) A histogram of the linear discriminant analysis (LDA) scores was calculated for the selected taxa which showed the significant bacterial difference between the PCT and LCT. LDA score at the log10 scale is indicated at the bottom. The greater the LDA score is, the more significant the microbial biomarker is in the comparison. (c) Significant differences in the abundance of predominant genera between the cancer patients and the healthy controls. The average abundance values for each bacterium is depicted as mean ±SEM. P values were calculated using the nonparametric Mann–Whitney test, and are shown in Supplementary table S2. Significant differences by *P < 0.05; **P < 0.01 and ***P < 0.001. HT, healthy subjects tongue coat; PCT, pancreatic cancer patients tongue coat; LCT, liver cancer patients tongue coat.