Figures & data
Figure 1. Experimental design for the rat model of dental caries.
Figure 2. Microbial population recovered from the animals at the end of the caries study. The total cultivable microbiota (a) and S. mutans strains (b) derived from rats infected by parental strain UA159 and deletion strains ΔgtfB, ΔlytS and ΔdltD. (c) The percentage of S. mutans (%) in the total cultivable microbiota. Bars with the same letters indicate no statistical difference between the different strains in each graph (p > 0.05; one-way ANOVA, followed by Tukey’s test). The data represented are the means, and the error bars correspond to the standard deviation (n = 14 per group).
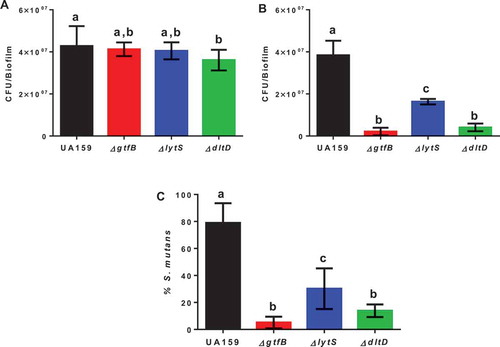
Figure 3. Influence of S. mutans strains on development and severity of dental caries on smooth (a) and sulcal (b) surfaces. The data displayed are the means, and the error bars correspond to the standard deviation (n = 14 per group). Bars with the same letters, by type of caries lesion, indicate no statistically significant differences between the strains (p > 0.05; two-way ANOVA, followed by the Tukey’s test). In the Dx category for both smooth and sulcal caries, no bars, other than S. mutans UA159, are represented, since the three deletion strains ΔgtfB, ΔlytS and ΔdltD did not yield this type of lesion. E: Enamel; Ds: light dentin caries; Dm: moderate dentin caries; and Dx: severe dentinal caries.
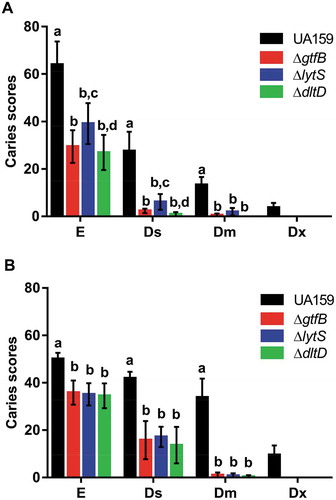
Figure 4. Survival of G. mellonella larvae after infection with S. mutans parental UA159 and deletion strains ΔgtfB, ΔlytT, ΔlytS, ΔdltA and ΔdltD. Virulence of S. mutans strains displayed by Kaplan-Meier survival curves. Estimates of differences in survival were compared using the Matel-Cox Log-rank test. All larvae survived the heat-killed (HK) control of all strains tested, therefore, the data shown for HK are representative results from one strain.
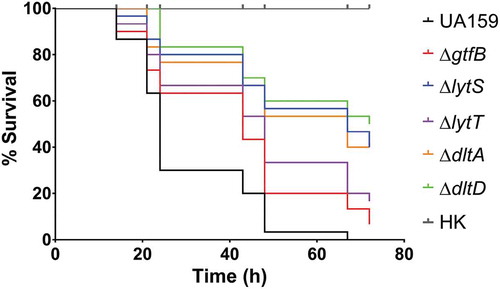
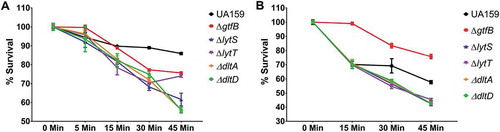
Figure 5. S. mutans parental UA159 and deletion strains ΔgtfB, ΔlytT, ΔlytS, ΔdltA and ΔdltD tolerance to hydrogen peroxide. The graphs show the different survival percentages of the strains population from planktonic culture (a) and biofilms (b) after longitudinal exposure to H2O2. The data shown are the means, and the error bars correspond to the standard deviation (n = 6 per group).