Figures & data
Table 1. Study population characteristics. All parameters tested were checked for normality. Metadata of the study population, which followed a Gaussian distribution were compared using t-test, chi-square test and ANOVA, whereas non-parametric data were compared by Mann-Whitney U test, Friedman test and Kruskall-Wallis H test. All statistics were computed with GraphPad Prism (Graphpad Software, San Diego, CA).
Table 2. Clinical data of the study population. Pocket depth (PD), clinical attachment loss (CAL), bleeding on probing (BOP), plaque index (PI), number of teeth excluding 3rd molars, number of decayed, missing, filled teeth (DMFT). All parameters tested were checked for normality. Metadata of the clinical data of the study population, which followed a Gaussian distribution were compared using t-test, chi-square test and ANOVA, whereas non-parametric data were compared by Mann-Whitney U test, Friedman test and Kruskall-Wallis H test. All statistics were computed with GraphPad Prism (Graphpad Software, San Diego, CA).
Table 3. Bacterial species with significantly different relative abundance in salivary samples from patients with periodontitis and oral health. The salivary microbiotas were characterized and compared by means of predominant genera and species, relative abundance, Shannon index, principal component analysis and correspondence analysis. Data on relative abundance were corrected for multiple dependent associations using Benjamini-Hochbergs correction [Citation26]. All statistics were computed with MeV [Citation27].
Table 4. Bacterial species with significant different relative abundance in salivary samples from patients with aggressive periodontitis. The salivary microbiotas were characterized and compared by means of predominant genera and species, relative abundance, Shannon index, principal component analysis and correspondence analysis. Data on relative abundance were corrected for multiple dependent associations using Benjamini-Hochbergs correction [Citation26]. All statistics were computed with MeV [Citation27].
Figure 1. Predominant bacterial genera. Mean relative abundance of predominant bacterial genera in patients with aggressive periodontitis, chronic periodontitis and orally healthy controls. The core salivary microbiota was defined as species/genus with a mean relative abundance >1% across sample. The predominant species/genera were compared using Mann-Whitney U test and Kruskall-Wallis test with Benjamini-Hochberg correction.
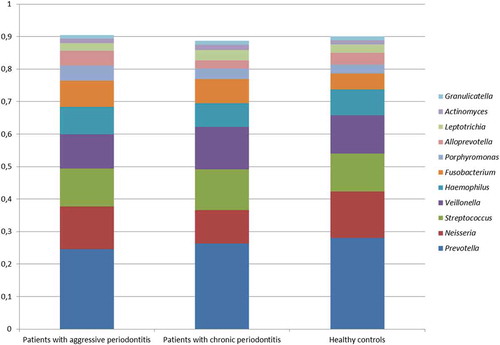
Figure 2. Principal component analysis. Principal component analysis visualized two-dimensionally with axes expressed as two principal components values accounting for a cumulative value of (38.0%). Sample denotation: aggressive periodontitis patients: blue, chronic periodontitis patients: red, healthy controls: green.
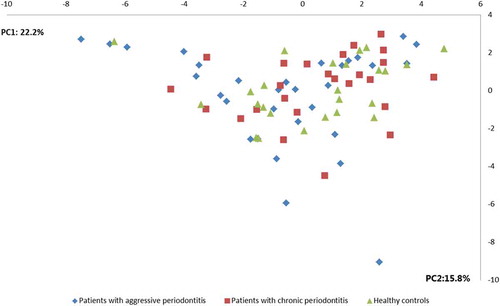
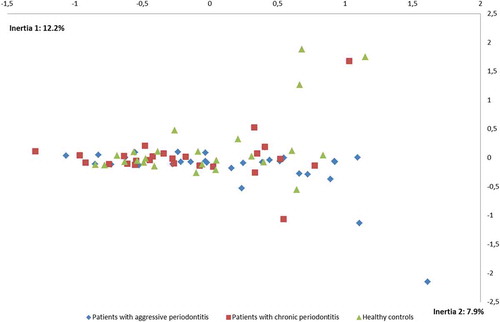
Figure 3. Correspondence analysis. Correspondence analysis visualized two-dimensionally with axes expressed as the two foremost inertia values accounting for a cumulative inertia of (20.1%). Sample denotation: aggressive periodontitis patients: blue, chronic periodontitis patients: red, healthy controls: green.