
Figures & data
Figure 1. Bacterial composition at interproximal sites and their associated vestibular and lingual surfaces. (a). Dental floss sampling at the interproximal (IPr) region between teeth 1.4 and 1.5, and sampling of supragingival dental plaque at vestibular and lingual surfaces with an autoclaved spoon excavator. The pictures are merely illustrative and were taken from a different patient which was not part of the study. (b). Bacterial community composition at genus level in the three sampled regions, as determined by 16S rRNA gene Illumina sequencing
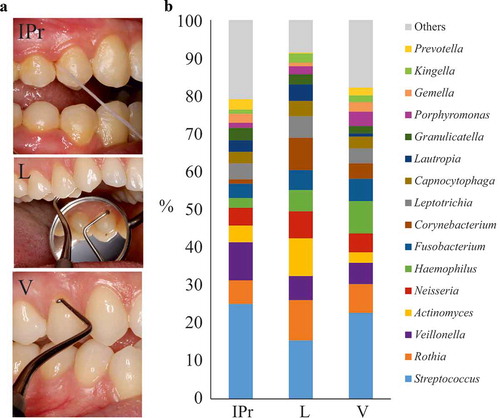
Figure 2. Comparison of microbiota associated with interproximal, vestibular and lingual regions. Samples are visualized in a PCA plot according to the relative abundance of genera, as determined by 16S rRNA gene Illumina sequencing (a). The estimated richness of bacterial species in each region is shown as rarefaction curves (b)
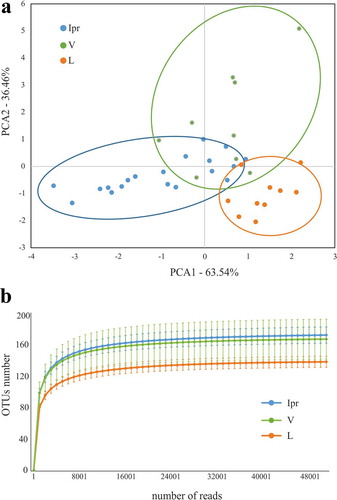
Figure 3. Differentially represented bacterial genera at interproximal sites and their associated vestibular and lingual regions. The abundance of differentially represented genera in the three analyzed regions is presented in a heatmap (left) and in bar plots (right). When a genus is significantly more abundant in one region, this is highlighted by box in the heatmap, and by asterisks in the bar plots (*: p-value<0.1; **: p-value<0.05)
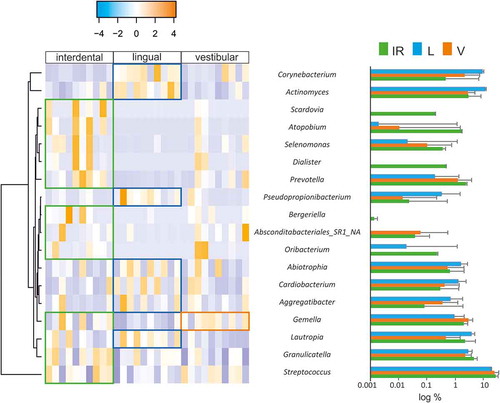
Figure 4. Variation of bacterial composition at the 1.4–1.5 teeth interproximal region through time. The composition at genus level was analysed by comparing the clustering of samples taken from the interproximal region at t0 and 1 month after (t1) by Principal Components Analysis (PCA). Samples from the same patient are drawn with the same colour
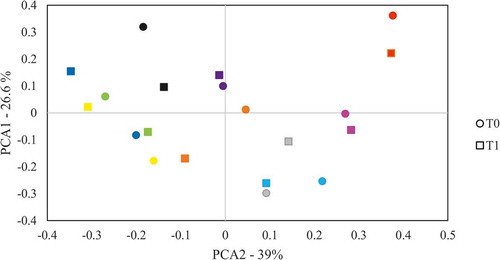
Table A1. Patients’ dataset