
Figures & data
Figure 1. Experimental design for evaluating the induction of dental caries in SPF rats
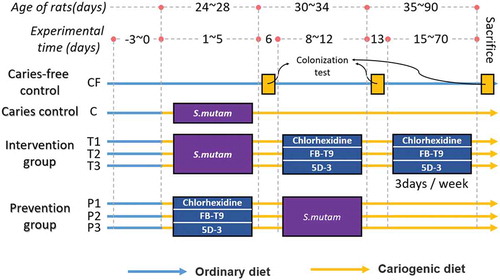
Figure 2. The inhibition effect of L. plantarum FB-T9 on S. mutans. (A and B) L. plantarum FB-T9 on TSA and 1/2 TSA plates; (C and D) S. mutans on TSA and 1/2TSA plates. Competition between FB-T9 and S. mutans: (E, G, I) on TSA plates; (F, H, J) on 1/2 TSA plates; (E and F) S. mutans and L. plantarum FB-T9 were inoculated on the plates at the same time; (G and H) L. plantarum FB-T9 was first inoculated on the plates; (I and J) S. mutans was first inoculated on the plates
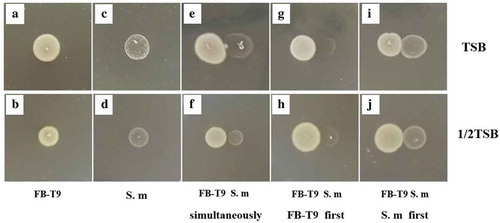
Figure 3. Biomass of S. mutans mediated by L. plantarum FB-T9 at different stages. C12, biofilm of negative control at 12 h. C24, biofilm of negative control at 24 h. C48, biofilm of negative control at 48 h. *P < 0.05 when compared with the control treatment and compared between groups
Figure 4. CLSM of S. mutans biofilm on glass coverslips. Addition of FB-T9 bacterial suspension at 0 h (A and B), 6 h (C and D), 12 h (E and F), 24 h (H and L) and 48 h (J and N) respectively. (G and K) S. mutans biofilm after incubation for 24 h with medium alone. (I and M) S. mutans biofilm after incubation for 48 h with medium alone. And A, C, E, G, H, I, J are corresponding 3D graphs
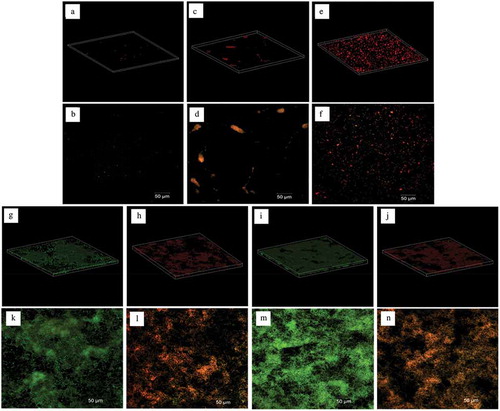
Figure 5. Total bacterial area of biofilm and biofilm viability after intervention by L. plantarum FB-T9 at different stages. The left axis corresponded to the histogram, showing the bacterial area of biofilm (×104 μm2). Biofilm mediated by FB-T9 at 0 h, 6 h, 12 h was compared to the 12 h negative control, while biofilm mediated by FB-T9 at 24 h and 48 h were compared to the 24 h and 48 h negative control, respectively. The dashed line indicated the biofilm viability of three controls, and the solid line indicated the biofilm viability after treatment at different stages. C12, biofilm of negative control at 12 h. C24, biofilm of negative control at 24 h. C48, biofilm of negative control at 48 h. The assay was performed three times and data are expressed as mean ± standard error of the mean. *P < 0.05 when compared with the control treatment and compared between groups
Table 1. S. mutans counts from rat dental samples at different periods
Figure 6. S. mutans & lactobacilli count from rat dental samples at different periods in prevention groups. (A) S. mutans counts; (B) lactobacilli counts; Data are expressed as mean ± standard error of the mean (n = 8)
Table 2. Number of linear units assigned to each molar
Table 3. Effect of different groups on caries development (incidence and severity) in rats