
Figures & data
Table 1. Overall participants’ background in 2016
Figure 1. Overall microbiome composition
A principal coordinate analysis was performed on the weighted UniFrac distance. The x- and y-axes represent the first and second principal coordinates with the proportion of variance. The 95% confidence ellipse is shown for each group. There was no statistically significant difference between former and never smokers; however, statistically significant differences were observed when comparing current versus former (right) as well as current versus never smokers (left).
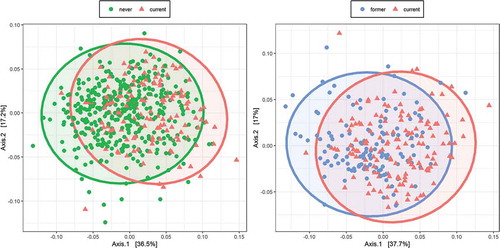
Table 2. Results of differential abundance of phyla in 2016
Figure 2. The violin plot representing the relative abundances of the phylum
The x-axis shows the smoking status and y-axis shows the relative abundance (log10 scaled).
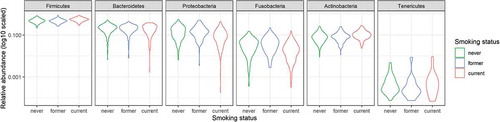
Figure 3. The result of comparison of bacterial abundance at the genus level
(a) The x-axis shows the shrinked log2 fold change of current smokers and standard error bars using never smokers as references, while the y-axis shows the genera. (b) The relative abundances are visualized by the violin plots. The x-axis shows the smoking status and y-axis shows the relative abundance (log10 scaled).
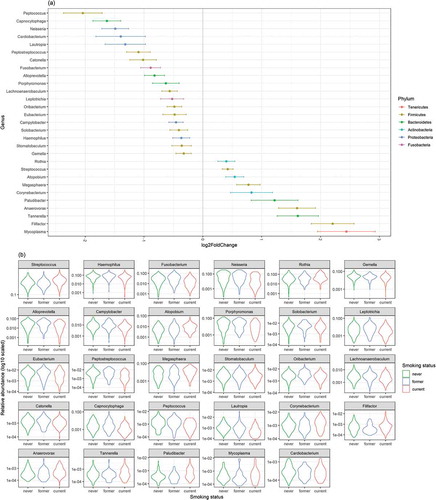
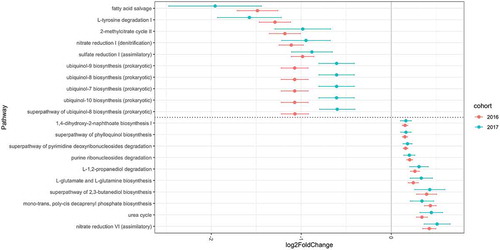
Figure 4. Log2 fold change in pathway abundance over never smoker levels
The x-axis shows the log2 fold change and standard error bars using never smokers as references, while the y-axis shows the selected pathways. The pathway above dotted line indicates these pathways were less abundant in current smokers, while the pathway below dotted line indicates more abundant in current smokers.
Supplemental material
Supplemental Material
Download MS Excel (1.1 MB)Data availability
The data that support the findings of this study are available from the corresponding author, Y.O., upon reasonable request.