Figures & data
Figure 1. P. gingivalis-induced changes in rat interdental papillae. (a) Representative H & E stained tissue sections from sham control and P. gingivalis inoculated animals. Panels to the right of each image are magnified images of the boxed region. Scale bars = 200 μm. (b) Subgingival microvascular density expressed as vessel number/tissue area (μm2), and (c) microvascular dilatation (total vessel lumen area/tissue area)
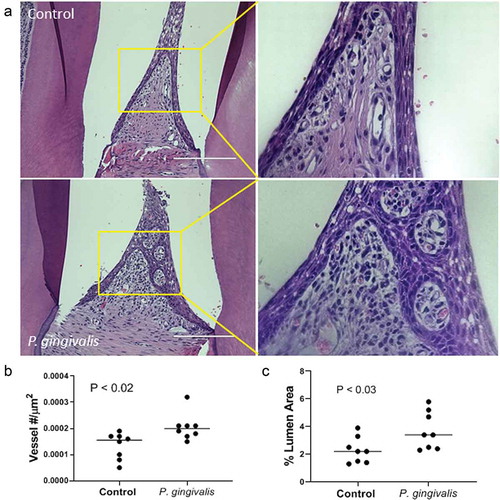
Figure 2. Representative images of P. gingivalis staining in the gingival tissue of interdental papillae. (a) H & E stained section of the gingival epithelium, showing the approximate region (boxed area) where P. gingivalis was detected by immunostaining (right panel). White arrow points to a P. gingivalis positive area (pseudocolored green) in the gingival epithelial layer that is also shown in the magnified inset. White arrowhead points to an autofluorescent red blood cell present in the section. (b) H & E stained section of the subgingival connective tissue matrix, boxed region indicates approximate location of where P. gingivalis positive subgingival capillaries were detected (white arrow, pseudocolored green) that is also included in the top magnified inset. The white arrowhead points to an autofluorescent red blood cell present in the section. Transillumination was used to demarcate tissue architecture and nuclei were stained with DAPI (blue). Scale bars are 50 μm
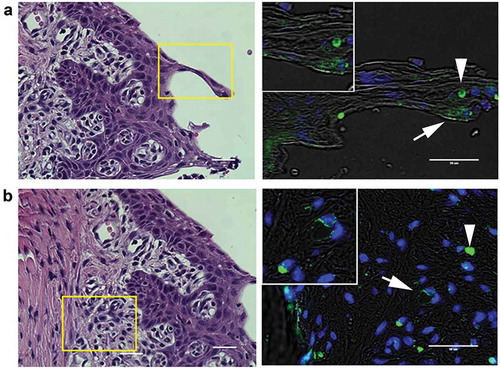
Figure 3. Invasion by no spin and spin inoculation (a), invasion and intracellular persistence of P. gingivalis within HD-MVEC maintained under constant antibiotic (b) or pulse antibiotic (c) treatment. (a) The proportion of bacterial inoculates enumerated from HD-MVEC cell lysates collected at 2.5 h post-inoculation (n = 4). (b) P. gingivalis inoculation was performed by centrifugation and antibiotics were added to HD-MVEC cultures at 1.5 h post-inoculation and maintained until cell harvest. Percent at 2.5 h post-inoculation represents the mean proportion of inoculate that was enumerated from HD-MVEC cell lysates at 2.5 h post-inoculation. Values at 6 and 24 h post-inoculation were determined by dividing the CFU obtained at each time point by the average CFU obtained at 2.5 h post-inoculation (i.e. invaded cells). Values represent the mean ± SD (n = 6) from two independent experiments. (c) P. gingivalis inoculation was performed by centrifugation. At 1.5 h PI, HD-MVEC were treated with antibiotics for 1 h. Values are expressed as the mean log CFU ± SD (n = 3)
Figure 4. Colocalization of P. gingivalis (DAPI) with ICAM-1, Rab7, LAMP1, Caveolin-1 (CAV), and Rab5. Representative images are from 6-h PI time points. Merged images contain all three channels displayed within the same row. DAPI stained P. gingivalis is pseudocolored red, and Rab7, LAMP1, and Rab5 are pseudocolored blue to improve visualization of bacterial colcocalization with each respective marker (white arrows). Graphs display the number of internalized P. gingivalis expressed as mean % ± SD from 3 independent experiments
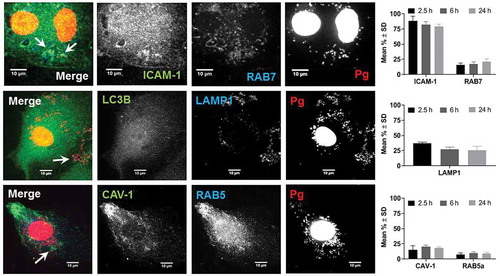
Figure 5. Inhibition of P. gingivalis invasion into HD-MVEC by anti-ICAM-1 antibody. Values represent the mean ± SD (n = 6) from two separate experiments. Percent values were determined by dividing the CFU of internalized bacteria by the CFU of the corresponding inoculate
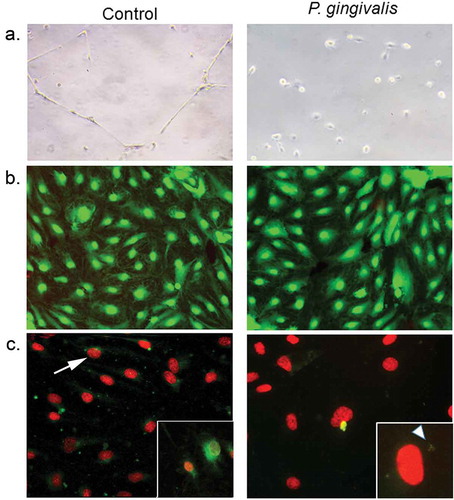
Figure 6. Impact of P. gingivalis infection on HD-MVEC network formation (a), viability (b), and apoptosis(c). (a) HD-MVEC network formation on Matrigel after 24 h. (b) HD-MVEC viability (green) assessed with LIVE/DEAD® Viability/Cytotoxicity Kit, dead cells are labelled red. (c) Apoptosis detected by activation of caspase 3/7 (green, white arrow) as shown in the magnified inset in control panel, which is an H2O2 positive control (arrow). Magnified inset in (c) P. gingivalis panel shows internalized bacteria (white arrowhead) confirming that cells were infected