Figures & data
Table 1. Strains of P. gingivalis and P. gulae used in this study.
Table 2. Known fimA genotypes of P. gulae strains/isolates as a reference.
Figure 1. Phylogenetic trees, based on the fimA and mfa1 nucleotide sequences. (a) The tree based on fimA is shown. Types I, II, III, IV, and V for P. gingivalis, and types A, B, and C for P. gulae are indicated by different colors. (B) The tree based on mfa1 is shown. Type 70 and type 53 are indicated by different colors. For each type, P. gingivalis and P. gulae are indicated by dark colors and light colors, respectively. The scale bar in each tree represents substitutions per nucleotide site.
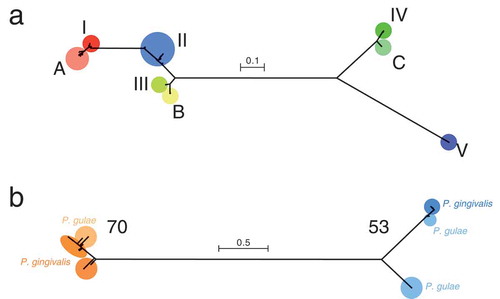
Figure 2. Variation in the amino acid sequences of FimA and Mfa1. The amino acid sequences of fimA (a) and mfa1 (b), as visualized using WebLogo, are shown. The alignment of the sequences is shown for each of eight fimA genotypes (a) and five mfa1 potential genotypes (b). Based on the phylogeny in ), the mfa1 genotypes 70 and 53 are divided into the clusters of each species. The cluster of P. gulae type 53 is further divided into putative subtype-a and subtype-b, which represent the upper and lower phylogroup, respectively, in ). The alignment is shown from the amino acid position 1 of N-terminal end to the last of C-terminal end, and for each 100 amino acids. In each genotype, the variation in amino acids at each position is indicated by the proportion of vertical length of characters. In particular strains, the absence of amino acids at a position is indicated by the width of characters. The positions where only a single amino acid exists among genotypes are colored.
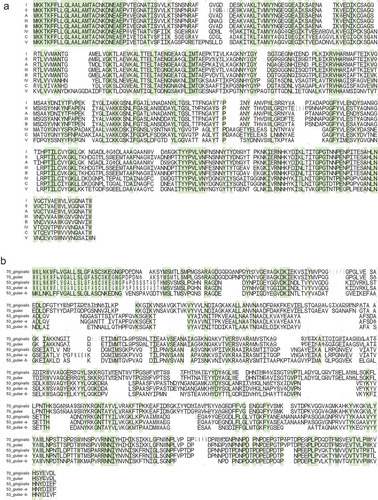
Figure 3. Conserved amino acid positions in the crystal structure of FimA. The three-dimensional structure of FimA of P. gingivalis W83 is shown. The conserved amino acid positions where only a single amino acid exists among genotypes are indicated by red. The N- and C-terminals are indicated.
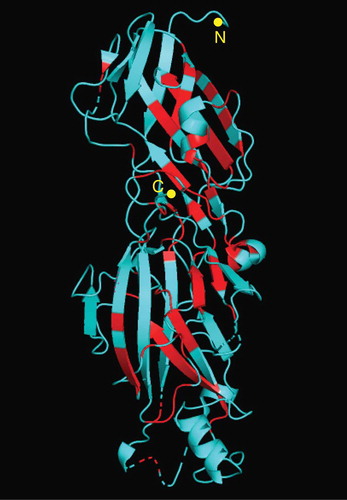
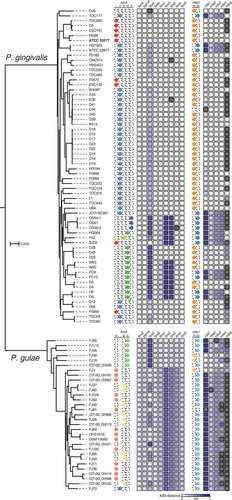
Figure 4. Phylogenetic tree based on the amino acid sequences of common CDSs, the fimA and mfa1 genotypes, and heat map for K80 distances of fim and mfa CDSs from P. gingivalis ATCC 33277. The tree based on 336 common CDSs in 64 P. gingivalis strains and 31 P. gulae strains is shown. The outgroup P. asaccharolytica DSM 20707 is not shown. The scale bar represents substitutions per amino acid site. The names of strains are on the right side of the tree. The genotypes of fimA are indicated by colored circles on the right side of the names of strains. For each fim-related CDS, the K80 distance values are indicated by the color gradient in the heat map. Black boxes in the heat map indicate the absence of the corresponding CDSs. The mfa1 genotypes and the K80 distance values for each mfa-related CDS are shown on the far right.