
Figures & data
Figure 1. Succinate catabolism pathways of P. gingivalis W50. The metabolic genes and pathway reactions of P. gingivalis W83 were sourced from KEGG with reference to Yoshida et al. [Citation44,Citation45] and Sato et al. [Citation46]. Gene products with their gene expression fold changes are listed in red for each gene that showed upregulation during P. gingivalis W50 growth in OB:CM relative to OBGM. Gene products listed in black were encoded by genes that did not show differential expression. The dotted arrow indicates that the gene coding for a 4-hydroxybutyrate CoA transferase in P. gingivalis is currently unknown.
![Figure 1. Succinate catabolism pathways of P. gingivalis W50. The metabolic genes and pathway reactions of P. gingivalis W83 were sourced from KEGG with reference to Yoshida et al. [Citation44,Citation45] and Sato et al. [Citation46]. Gene products with their gene expression fold changes are listed in red for each gene that showed upregulation during P. gingivalis W50 growth in OB:CM relative to OBGM. Gene products listed in black were encoded by genes that did not show differential expression. The dotted arrow indicates that the gene coding for a 4-hydroxybutyrate CoA transferase in P. gingivalis is currently unknown.](/cms/asset/c7bf090a-e31f-4ba7-b4d2-28c23903003c/zjom_a_1808750_f0001_oc.jpg)
Figure 2. P. gingivalis folate-mediated one carbon superpathway. The red and cyan proteins (with corresponding colored arrows) are encoded by metabolic genes that showed significant (>1.5-fold, FDR <0.05) upregulation and downregulation respectively. The black proteins are encoded by genes that showed no change in expression during P. gingivalis W50 growth in OB:CM, relative to OBGM. Not shown is the formate transporter PG0209 whose gene was downregulated 3.21-fold. The dotted arrows indicate enzymatic steps that have not been expanded for the sake of brevity.
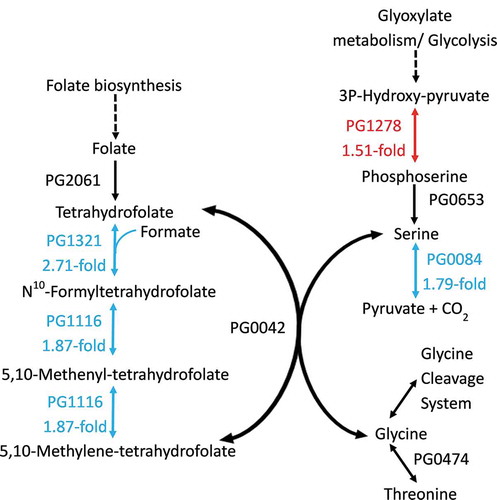
Figure 3. Growth of P. gingivalis wild type (red line) and ΔPG0753 (green line), ΔPG1605 (black line) and ΔPG1788 (blue line) strains in OB:CM. Bacterial strains were grown under anaerobic conditions at 37°C in static culture and the cell growth was determined by measurement of optical density at a wavelength of 650 nm (OD650). Data presented is the mean and standard deviation (n = 6) comprised of triplicates in two independent experiments.
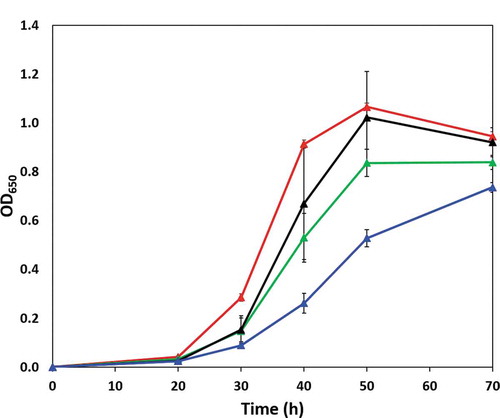
Table 1. Rate of free glycine production by P. gingivalis W50 wild type and mutant strains in OB:CM. The rate of free glycine production for each P. gingivalis W50 strain was determined from the slope of a linear regression line that indicated the change of free glycine against 109 P. gingivalis cells per h, as measured over a 10 h time period during the time interval of 30 to 40 h of growth.