
Figures & data
Figure 1. Nisin-producing probiotic inhibits oral biofilm formation, structure, and viability.
Biofilms were grown with non-nisin producing L. lactis (panels a and d), nisin (panels b and e) and nisin producing L. lactis (panels c and f) for 24 h. Changes in biofilm biomass were then measured as the optical density of the crystal violet staining at 600 nm; *means statistical difference (p < 0.05) between the marked sample and control. Panels d, e, and f show representative images of fluorescently labeled biofilms under different treatment conditions. The columns, from left to right, represent the different staining conditions; SYTO9, a membrane permeable and live cell stain and propidium iodide, a membrane-impermeable dead-cell stain, and the merged image shows the double and overlapping staining pattern (Syto 9 and propidium iodide). The rows represent the different treatments applied; from top to bottom, no treatment (Control), 6 × 10³ and 105 CFU/mL of non-nisin producing L. lactis, 1 and 2 µg/mL of nisin treatment; 6 × 10³ and 105 CFU/mL of nisin-producing L. lactis. Scale bar represents 10 µm. Quantification of Syto9 and PI labelled bacteria from confocal images. *means statistical difference (p < 0.05) between the sample and control. The 2D biofilm area (g) and viability (h) were quantified for treatment groups represented in panels d, e, and f.
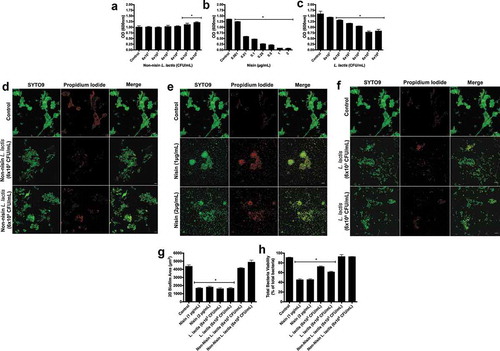
Figure 2. Nisin-producing probiotic disrupts oral biofilm formation, structure, and viability.
Biofilms were grown for 48 h, then treated for 24 h with non-nisin producing L. lactis (a and d), nisin (b and e), and nisin-producing L. lactis (c and f), then changes in biofilm biomass (a-c), 2D biofilm area (g), and viability (h) were evaluated. For the biofilm biomass, the results were measured as the optical density of the crystal violet staining at 600 nm. *means statistical difference (p < 0.05) between the marked sample and control. Panels d, e, and f show representative images of fluorescently labeled biofilms under different treatment conditions. The columns, from left to right, represent the different staining conditions; SYTO9, a membrane permeable and live cell stain and propidium Iodide, a membrane-impermeable dead-cell stain, and the merged image show the double and overlapping staining pattern (Syto 9 and propidium iodide). The rows represent the different treatments applied; from top to bottom, no treatment (Control), 6 × 10³ and 105 CFU/mL of non-nisin producing L. lactis, 1 and 10 µg/mL of nisin treatment; 6 × 10³ and 105 CFU/mL of nisin-producing L. lactis. Scale bar represents 10 µm. Quantification of Syto9 and PI labelled bacteria from confocal images. *means statistical difference (p < 0.05) between the sample and control. The 2D biofilm area (g) and viability (h) were quantified for treatment groups represented in panels d, e, and f.
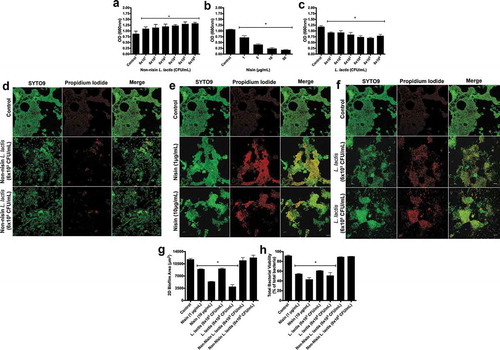
Figure 3. Nisin-producing probiotic disrupts pathogen-spiked oral biofilm formation, structure, and viability.
Biofilms were grown for 48 h, then spiked with P. gingivalis, T. denticola, and F. nucelatum for 24 h, and finally treated for 24 h with non-nisin producing L. lactis (a,b), nisin (a,c), and nisin-producing L. lactis (a,d), then changes in biofilm biomass (a), 2D biofilm area (b-d,e), and viability (b-d,f) were evaluated. For the biofilm biomass, the results were measured as the optical density of the crystal violet staining at 600 nm. *means statistical difference (p < 0.05) between the marked sample and control. Panels b, c, and d show representative images of fluorescently labeled biofilms under different treatment conditions. The columns, from left to right, represent the different staining conditions; SYTO9, a membrane permeable and live cell stain and propidium Iodide, a membrane-impermeable dead-cell stain, and the merged image show the double and overlapping staining pattern (Syto 9 and propidium iodide). The rows represent the different treatments applied; from top to bottom, no treatment (Control), pathogen infected, pathogen infected and treated with 6 × 10³ and 105 CFU/mL of non-nisin producing L. lactis, pathogen infected and treated with1 and 10 µg/mL of nisin treatment; and pathogen infected and treated with 6 × 10³ and 105 CFU/mL of nisin-producing L. lactis. Scale bar represents 10 µm. Quantification of Syto9 and PI labelled bacteria from confocal images. *means statistical difference (p < 0.05) between the sample and control biofilms. **mean statistical difference (p < 0.05) between the sample and the pathogen-spiked biofilms (Biofilm). The 2D biofilm area (e) and viability (f) were quantified for treatment groups represented in panels b, c, and d.
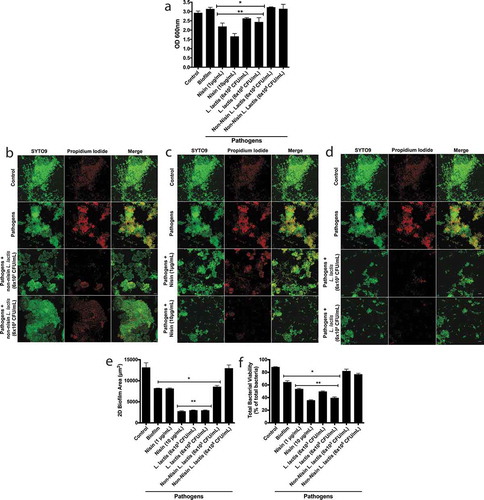
Figure 4. Biofilm bacterial diversity returns to control levels with nisin-producing probiotic or nisin.
Biofilm Shannon (a) Diversity Index and Phyla (b), Genera (c) and Species (d) community composition are illustrated, after treatment with nisin, nisin-producing L. lactis and non-nisin producing L. lactis in the pathogen-spiked 48 h preformed biofilms, with data obtained from 16S rRNA sequencing analysis. * represents significant difference (p < 0.05) between sample and non-pathogenic biofilms (Control). ** represent significant difference (p < 0.05) between sample and the pathogen spiked biofilms (Biofilm).
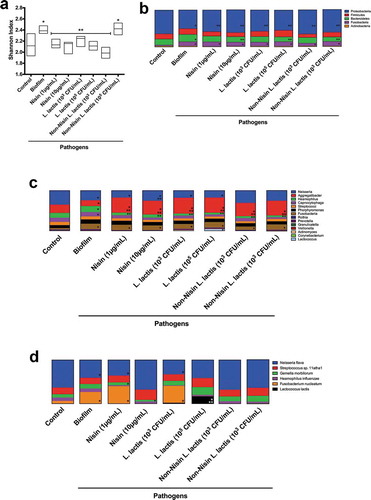
Figure 5. Nisin-producing probiotic and nisin significantly suppress F nucleatum, T. forsythia and K. pneumoniae, while promoting commensals in pathogen-spiked oral biofilms.
The levels of H. influenzae (a), F. nucleatum (b), T. forsythia (c), N. flava (d), L. lactis (e), and K. pneumoniae (f) obtained from 16S rRNA sequencing analysis in the pathogen-spiked biofilms after treatment with nisin, nisin-producing L. lactis and non-nisin producing L. lactis are illustrated in the graphs as a percentage of the total bacteria present in the biofilms. * indicates significant difference (p < 0.05) between the sample genera and control genera. ** represent significant difference (p < 0.05) between the sample genera and biofilm (pathogen containing) genera.
Supplemental material