
Figures & data
Table 1. Clinical parameters of diseased (DD) and healthy (DH) sites in grade C molar incisor pattern periodontitis (C/MIP) individuals before (baseline) and 3 and 6 months after treatment.
Figure 1. Differentially abundant species between disease and healthy sites before and after treatment in C/MIP patients. Species with a significant 2-fold difference in intensity between DD and DH sites at (a) Baseline, (b) 3 months post-treatment, and (c) 6 months post-treatment. (d) Mean intensity of A.a. in DD and DH sites through the study period. E. Mean intensity of F. alocis in DD and DH sites through the study period. DH site samples from 12 M, 18 M, and 24 M had too little material for HOMIM analysis. Values are mean ± SD. *P < 0.05, **P < 0.01, ***P < 0.001 between DD and DH. +P < 0.05, ++P < 0.01, +++P < 0.001 in DD compared to baseline. DD – diseased sites in C/MIP; DH – healthy sites in C/MIP.
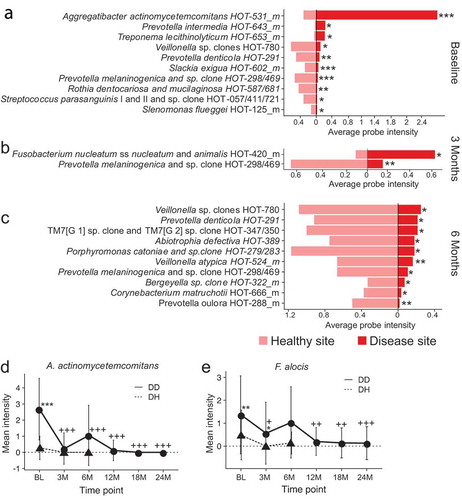
Table 2. Average probe intensity of species significantly different between DD and DH sites at baseline.
Figure 2. Bacterial diversity of DD and DH sites before and after treatment of C/MIP patients. (a) Principal coordinates analysis (PCoA) shows separation between clusters at baseline DD and DH sites is more profound than after treatment (P < 0.001). (b) PCoA of samples 3 months after treatment shows substantial overlap in bacterial profiles of DD and DH sites, but DH sites cluster more tightly (P < 0.05). (c) PCoA of samples 6 months after treatment shows substantial overlap in bacterial profiles of DD and DH sites, but DH sites cluster more tightly (P < 0.05). DD – red circles, DH – pink squares, and ellipses show 95% confidence intervals. (d) The number of species detected in DD sites at BL, 3, and 6 months after treatment is lower than in DH sites, but not significantly different. (e) The number of species detected in DD sites rises 3 months after treatment but falls at 6–24 months, but no differences are significant. (f) Shannon diversity in DD site samples at BL, 3 M, and 6 M is lower than DH sites, but not significantly different. (g) Shannon diversity increases in DD samples 3 months after treatment and then fall at 6–24 months after treatment, but no differences are significant. DD – diseased sites in C/MIP; DH – healthy sites in C/MIP.
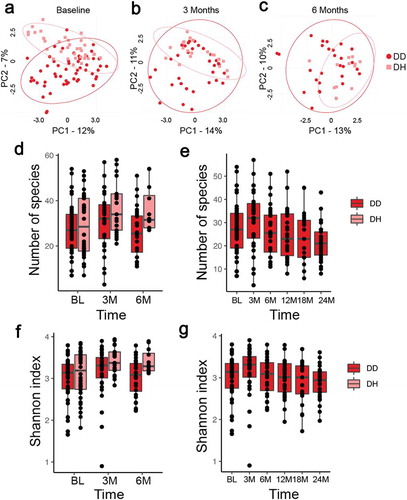
Table 3. Prevalence of species significantly different between DD and DH sites at baseline.
Figure 3. Changes in prevalence of health- and disease-associated species following treatment of C/MIP patients. The prevalence of disease-associated (a) A.a., (b) F. alocis, (c) T. forsythia, (d) C. gracilis, and E. Haemophilus spp. in DD sites drops following treatment, and remain less prevalent in DD sites than at baseline. In contrast, the prevalence of health-associated (f) S. anginosus/gordonii, (g) S. parasanguinis, and (h) R. dentocariosa/mucilaginosa rise following treatment and remain more abundant in DD sites than at baseline. DH site samples from 12 M, 18 M, and 24 M had too little material for HOMIM analysis. Values are mean ± SD. *P < 0.05, **P < 0.01, ***P < 0.001 between DD and DH. +P < 0.05, ++P < 0.01, +++P < 0.001 in DD compared to baseline. DD – diseased sites in C/MIP; DH – healthy sites in C/MIP.
Table 4. Species clusters in C/MIP disease and healthy sites before and after treatment.