1,188
Views
3
CrossRef citations to date
0
Altmetric
Original Article

Investigation of the potential regulator proteins associated with the expression of major surface protein and dentilisin in Treponema denticola

, , , , &
Article: 1829404 | Received 01 Apr 2020, Accepted 21 Sep 2020, Published online: 11 Oct 2020

Figures & data

Table 1. Primers for PCR and qRT-PCR.

Table 2. Upregulated genes in prtP-deficient mutant.

Table 3. Genes downregulated in prtP-deficient mutant.

Table 4. Genes upregulated in msp-deficient mutant.

Table 5. Genes downregulated in msp-deficient mutant.

Figure 1. Expression of msp and prtP determined using qRT-PCR. (a) Expression of msp. (b) Expression of prtP (dentilisin); 35405: T. denticola ATCC 35405 (wild type), K1: dentilisin mutant, DMSP3: msp mutant. The expression of each gene is presented as fold-change over that in the wild type strain. Data are presented as means ± SD (n = 6), and statistically significant differences are indicated using asterisks (one-way ANOVA with Dunnett’s multiple comparison test; *p < 0.05 compared to the wild type).

Figure 1. Expression of msp and prtP determined using qRT-PCR. (a) Expression of msp. (b) Expression of prtP (dentilisin); 35405: T. denticola ATCC 35405 (wild type), K1: dentilisin mutant, DMSP3: msp mutant. The expression of each gene is presented as fold-change over that in the wild type strain. Data are presented as means ± SD (n = 6), and statistically significant differences are indicated using asterisks (one-way ANOVA with Dunnett’s multiple comparison test; *p < 0.05 compared to the wild type).

Figure 2. SDS-PAGE and immunoblot analysis of sonicates of T. denticola ATCC 35405, DMSP3, and K1. SDS-PAGE analysis (a) and immunoblot analysis (b).
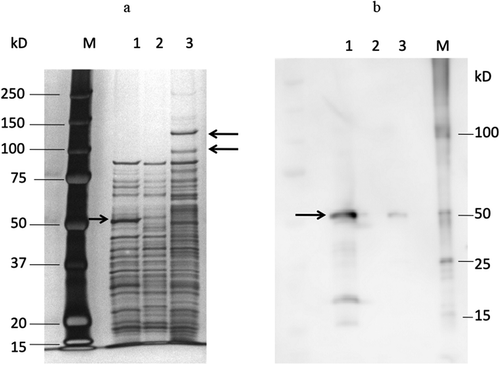
(a) Lane M: Molecular size marker; lane 1: T. denticola ATCC 35405 (wild type, 10 µg protein); lane 2: T. denticola DMSP3 (msp mutant, 10 µg protein); lane 3: T. denticola K1 (prtP mutant, 10 µg protein). After electrophoresis, the gel was stained with silver stain. Arrow in lane 1 indicates the Msp band and arrows in lane 3 indicate the 100 kDa and 130 kDa bands. (b) Lane 1: T. denticola ATCC 35405 (wild type, 10 µg protein);lane 2: T. denticola DMSP3 (msp mutant, 10 µg protein); lane 3: T. denticola K1 (prtP mutant, 10 µg protein); M: molecular size marker. Msp was detected by 1/20,000 diluted anti-Msp antibody. Arrow in lane 1 indicates the band of Msp.
Figure 2. SDS-PAGE and immunoblot analysis of sonicates of T. denticola ATCC 35405, DMSP3, and K1. SDS-PAGE analysis (a) and immunoblot analysis (b).

Figure 3. Dentilisin activity of wild type (35405) and msp-deficient mutant (DMSP3). Data are presented as means ± SD, and statistically significant differences are indicated by asterisks (student t-test; *p < 0.05 compared to the wild type). 35405: T. denticola ATCC 35405, DMSP3: T. denticola DMSP3, cell: cells of T. denticola, sup: culture supernatant of T. denticola, log: log phase, stationary: stationary phase.
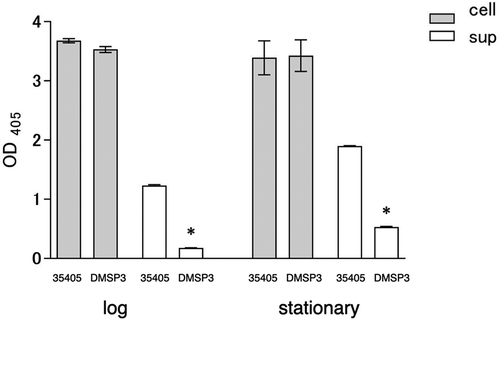
Figure 3. Dentilisin activity of wild type (35405) and msp-deficient mutant (DMSP3). Data are presented as means ± SD, and statistically significant differences are indicated by asterisks (student t-test; *p < 0.05 compared to the wild type). 35405: T. denticola ATCC 35405, DMSP3: T. denticola DMSP3, cell: cells of T. denticola, sup: culture supernatant of T. denticola, log: log phase, stationary: stationary phase.

Figure 4. Gene expression of the potential regulator proteins in wild type (35405), msp-deficient mutant (DMSP3), and prtP-deficient mutant (K1). Gene expression levels were evaluated using qRT-PCR with a Taqman probe. The expression of TDE_0127 (a), TDE_0344 (b), and TDE_0814 (c) are presented as fold-change with respect to that of the wild type strain. Data are presented as means ± SD (n = 6), and statistically significant differences are indicated by asterisks (one-way ANOVA with Dunnett’s multiple comparison test; *p < 0.05 compared to wild type).
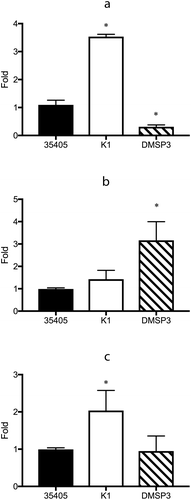
Figure 4. Gene expression of the potential regulator proteins in wild type (35405), msp-deficient mutant (DMSP3), and prtP-deficient mutant (K1). Gene expression levels were evaluated using qRT-PCR with a Taqman probe. The expression of TDE_0127 (a), TDE_0344 (b), and TDE_0814 (c) are presented as fold-change with respect to that of the wild type strain. Data are presented as means ± SD (n = 6), and statistically significant differences are indicated by asterisks (one-way ANOVA with Dunnett’s multiple comparison test; *p < 0.05 compared to wild type).