Figures & data
Table 1. Virulence factors of Porphyromonas gingivalis and their known genetic variation between strains W83 and TDC60. Kgp is a subtype of the proteinase gingipains; FimA is the major protein subunit of the major fimbriae; FimCDE are the accessory proteins of the major fimbriae; Mfa1 is the major protein subunit of the minor fimbriae; RagAB are outer membrane proteins and lipoproteins; the capsule is the capsular polysaccharide antigens (K-antigen).
Table 2. Evolution of the animals’ weight during the experiments. Data are presented as mean ± standard error (n = 6 mice/group). The p-value of the Kruskal–Wallis test is indicated.
Figure 1. P. gingivalis specific 16S rRNA gene amplicons from DNA of oral swabs after electrophoresis on a 3% agarose gel. 1–2: sham-infected mice (controls); 3–4: W83-treated mice; 5–6: TDC60-treated mice; N: negative control; P: positive control (expected amplicon size: 161 bp). M: molecular weight marker (Quick-Load Low Molecular Weight DNA Ladder, NEB®).
Figure 2. Alveolar bone loss in mice. Measurements of bone levels were made by comparing the distance from the cementoenamel junction (CEJ) to the alveolar bone crest (ABC) (a, b) and the percentage of remaining bone (c, d) at two interdental sites: between the first and second mandibular molars (M1M2) and between the second and the third mandibular molars (M2M3). Root lengths (from the CEJ to the root apex) were also measured to assess the percentage of remaining alveolar bone: Percent remaining bone (%) = ([root length – CEJ-ABC]/root length) x 100. Representative images of micro-CT of control (e), TDC60-treated (f) and W83-treated (g) mice are presented. Control and P. gingivalis infected mice were 16 weeks old (n = 6 mice/group). Dunn’s Kruskal–Wallis multiple comparisons, statistically significant at: *p < 0.05; **p < 0.01.
![Figure 2. Alveolar bone loss in mice. Measurements of bone levels were made by comparing the distance from the cementoenamel junction (CEJ) to the alveolar bone crest (ABC) (a, b) and the percentage of remaining bone (c, d) at two interdental sites: between the first and second mandibular molars (M1M2) and between the second and the third mandibular molars (M2M3). Root lengths (from the CEJ to the root apex) were also measured to assess the percentage of remaining alveolar bone: Percent remaining bone (%) = ([root length – CEJ-ABC]/root length) x 100. Representative images of micro-CT of control (e), TDC60-treated (f) and W83-treated (g) mice are presented. Control and P. gingivalis infected mice were 16 weeks old (n = 6 mice/group). Dunn’s Kruskal–Wallis multiple comparisons, statistically significant at: *p < 0.05; **p < 0.01.](/cms/asset/11cc4586-34f3-4dea-aefa-e51ffdd9d115/zjom_a_1832837_f0002_oc.jpg)
Figure 3. Alpha and beta diversity of the oral microbiota of mice. Bioinformatics processing of the microbiota samples from the oral cavity of control and P. gingivalis infected mice (n = 6 mice/group, 16 weeks old) allowed for Principal Coordinate Analysis (PCoA). The PCoA calculated with weighted UniFrac metric revealed clustering of W83-treated mice (a). Analysis of distances between samples showed significant differences between W83- and TDC60-treated mice, with both PERMANOVA and ANOSIM tests (**p < 0.01, b). Alpha diversity analysis showed significantly lower richness (Sobs, c) and lower evenness (Shannon-Weaver, d) in W83-treated mice; Dunn’s Kruskal–Wallis multiple comparisons, statistically significant at: *p < 0.05.
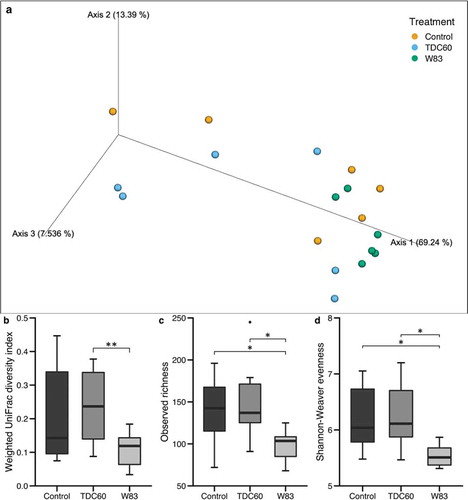
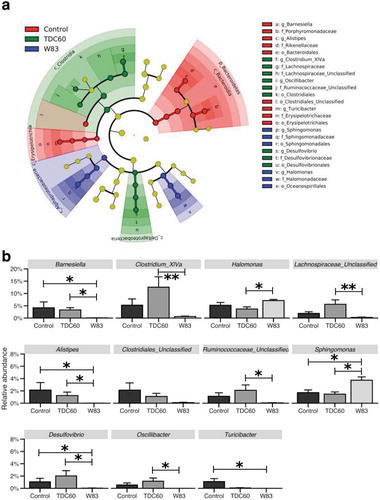
Figure 4. Analysis of taxa relative abundances in the oral cavity according to the treatment of mice. The linear discriminant analysis with effect size (LEfSe) cladogram identified taxa that were differentially abundant across the groups (n = 6 mice/group; p < 0.05) (a). Taxa at the genus-level were then filtered (excluding those with a mean relative abundance < 1% in all groups), and plotted when the Kruskal–Wallis test returned significant result (p < 0.05) (b). Dunn’s Kruskal–Wallis multiple comparisons, statistically significant at: *p < 0.05; **p < 0.01.